
Quarto: Part II
Making useful things reproducibly
2026-05-10
Follow-along


…The initial aim of the project was to repeat 193 experiments from 53 high-impact papers…However, the various barriers and challenges we encountered while designing and conducting the experiments meant that we were only able to repeat 50 experiments from 23 papers…
Errington, Denis, Perfito, Iorns, & Nosek (2021)
…the data needed to compute effect sizes and conduct power analyses was publicly accessible for just 4 of 193 experiments…none of the 193 experiments were described in sufficient detail in the original paper to enable us to design protocols to repeat the experiments…
Errington et al. (2021)
…While authors were extremely or very helpful for 41% of experiments, they were minimally helpful for 9% of experiments, and not at all helpful (or did not respond to us) for 32% of experiments…
Errington et al. (2021)
…This experience draws attention to a basic and fundamental concern about replication – it is hard to assess whether reported findings are credible.
Errington et al. (2021)
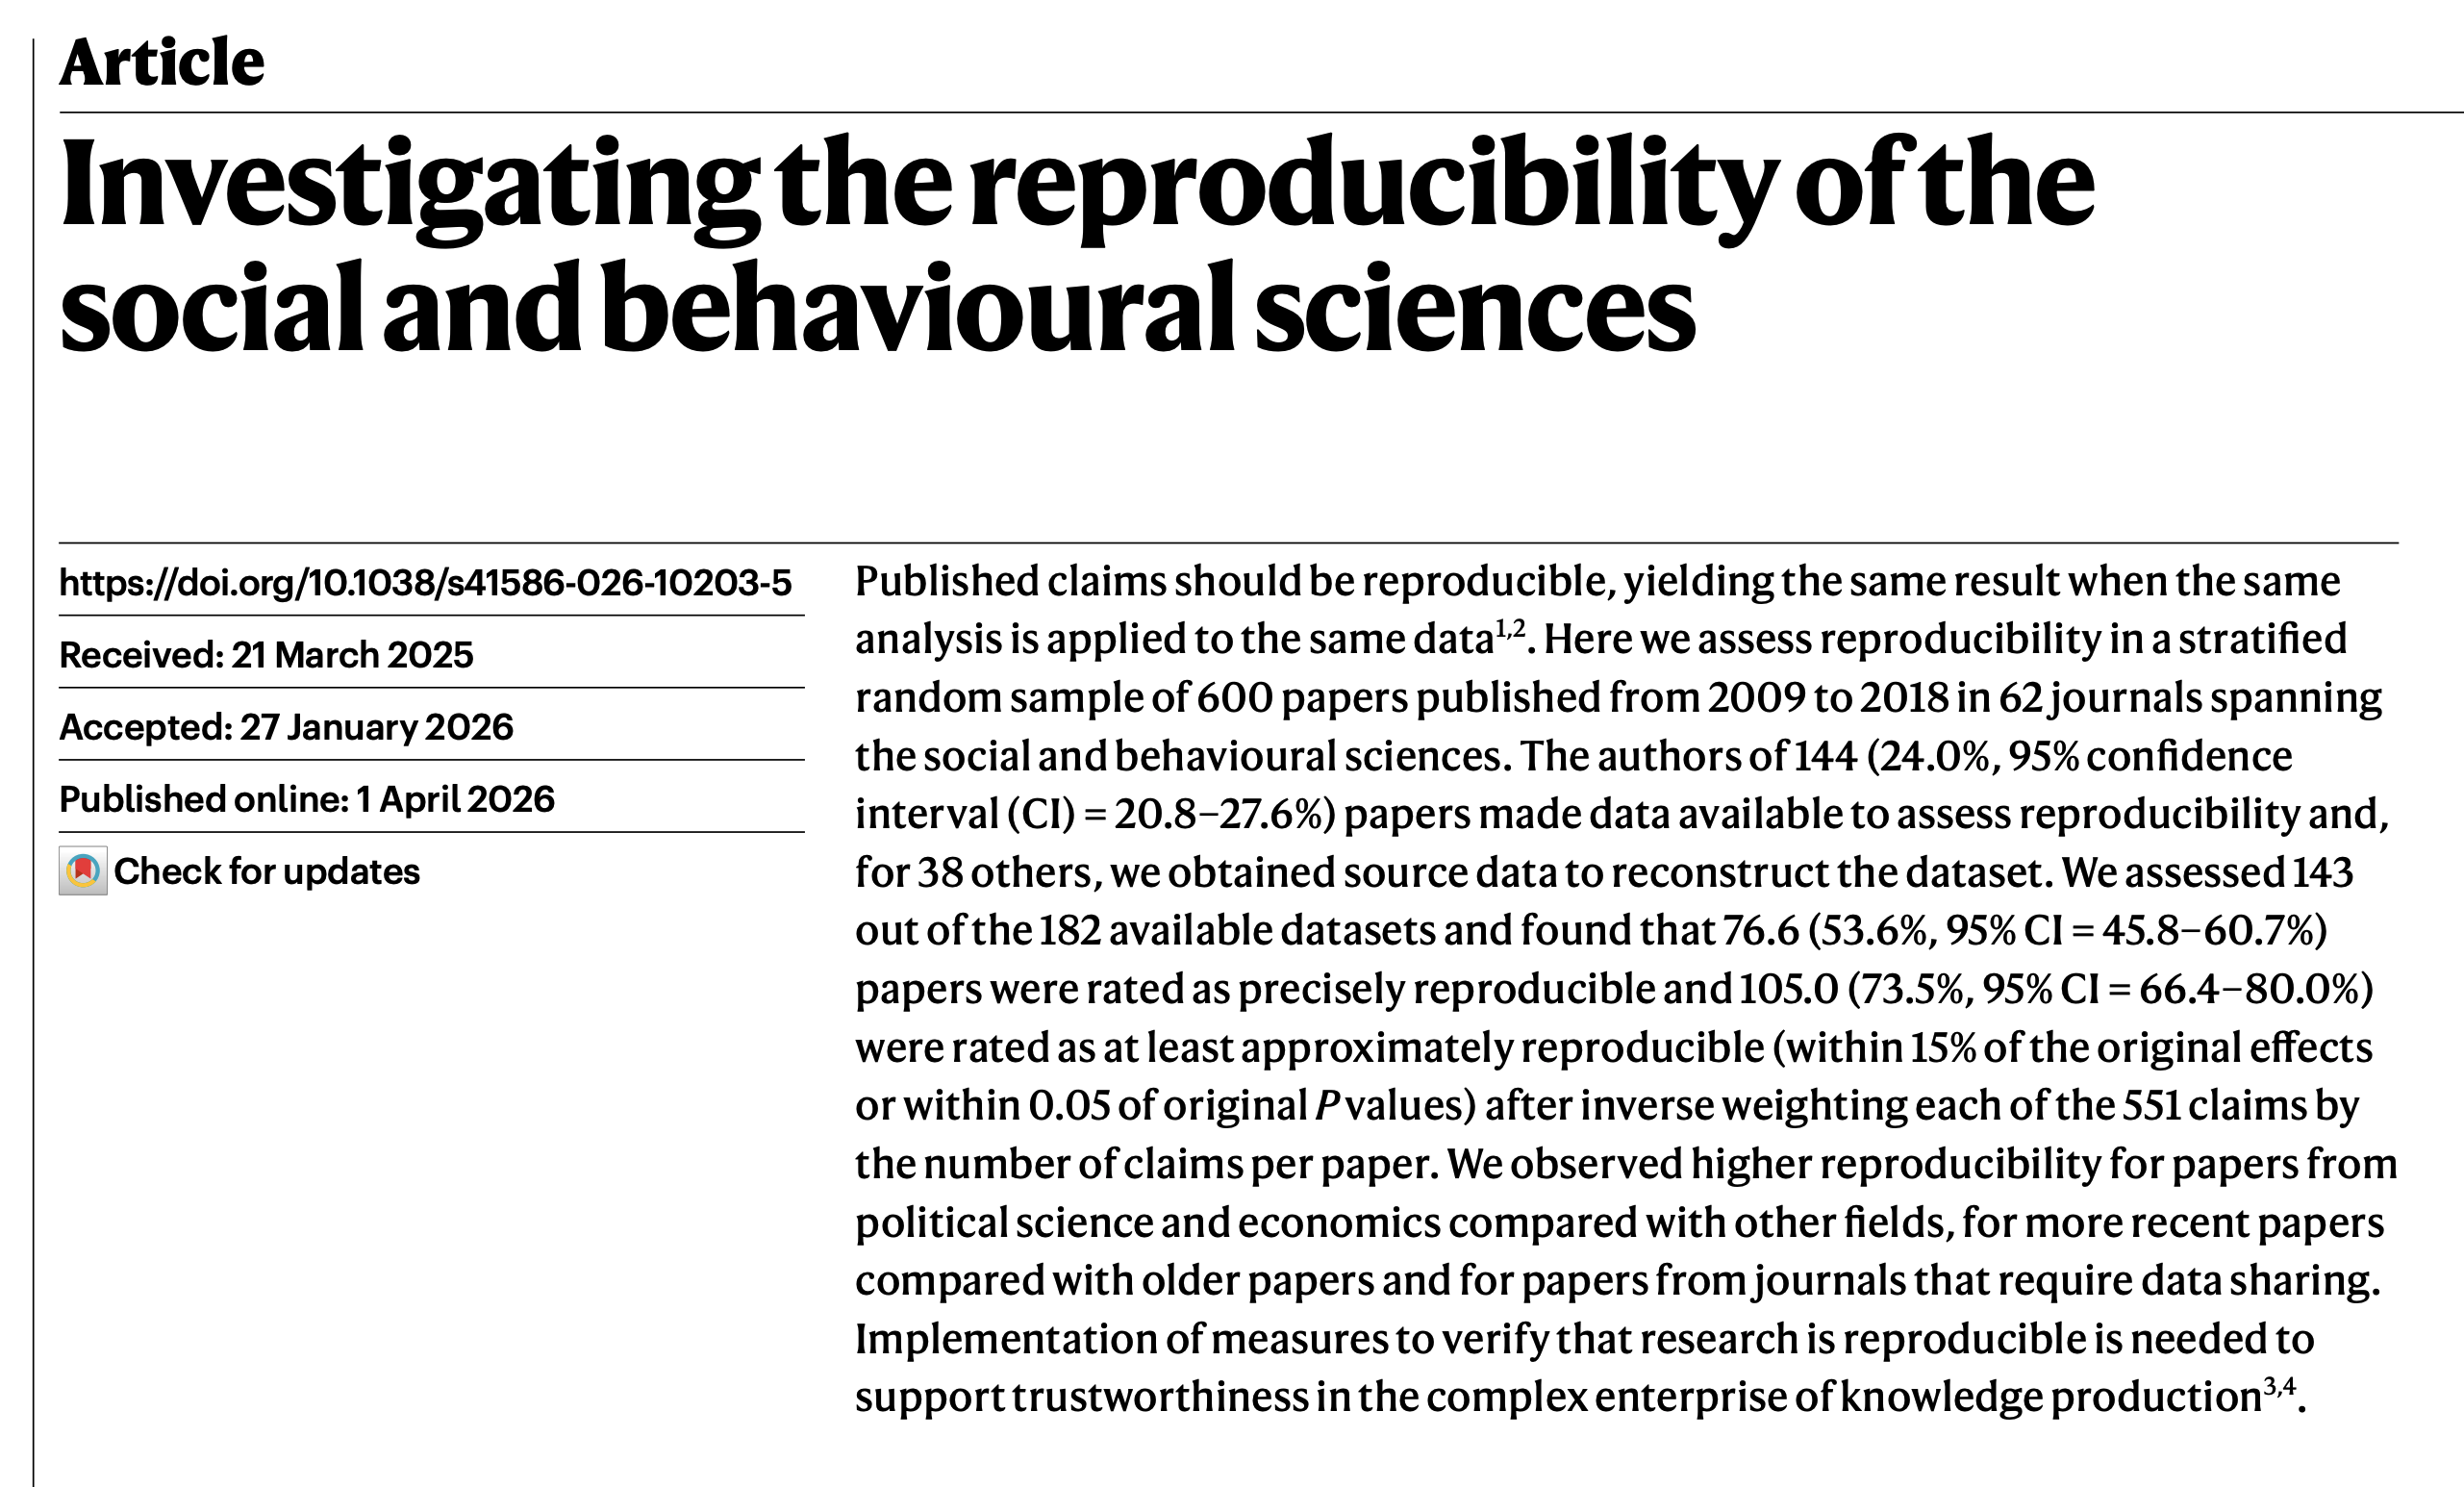
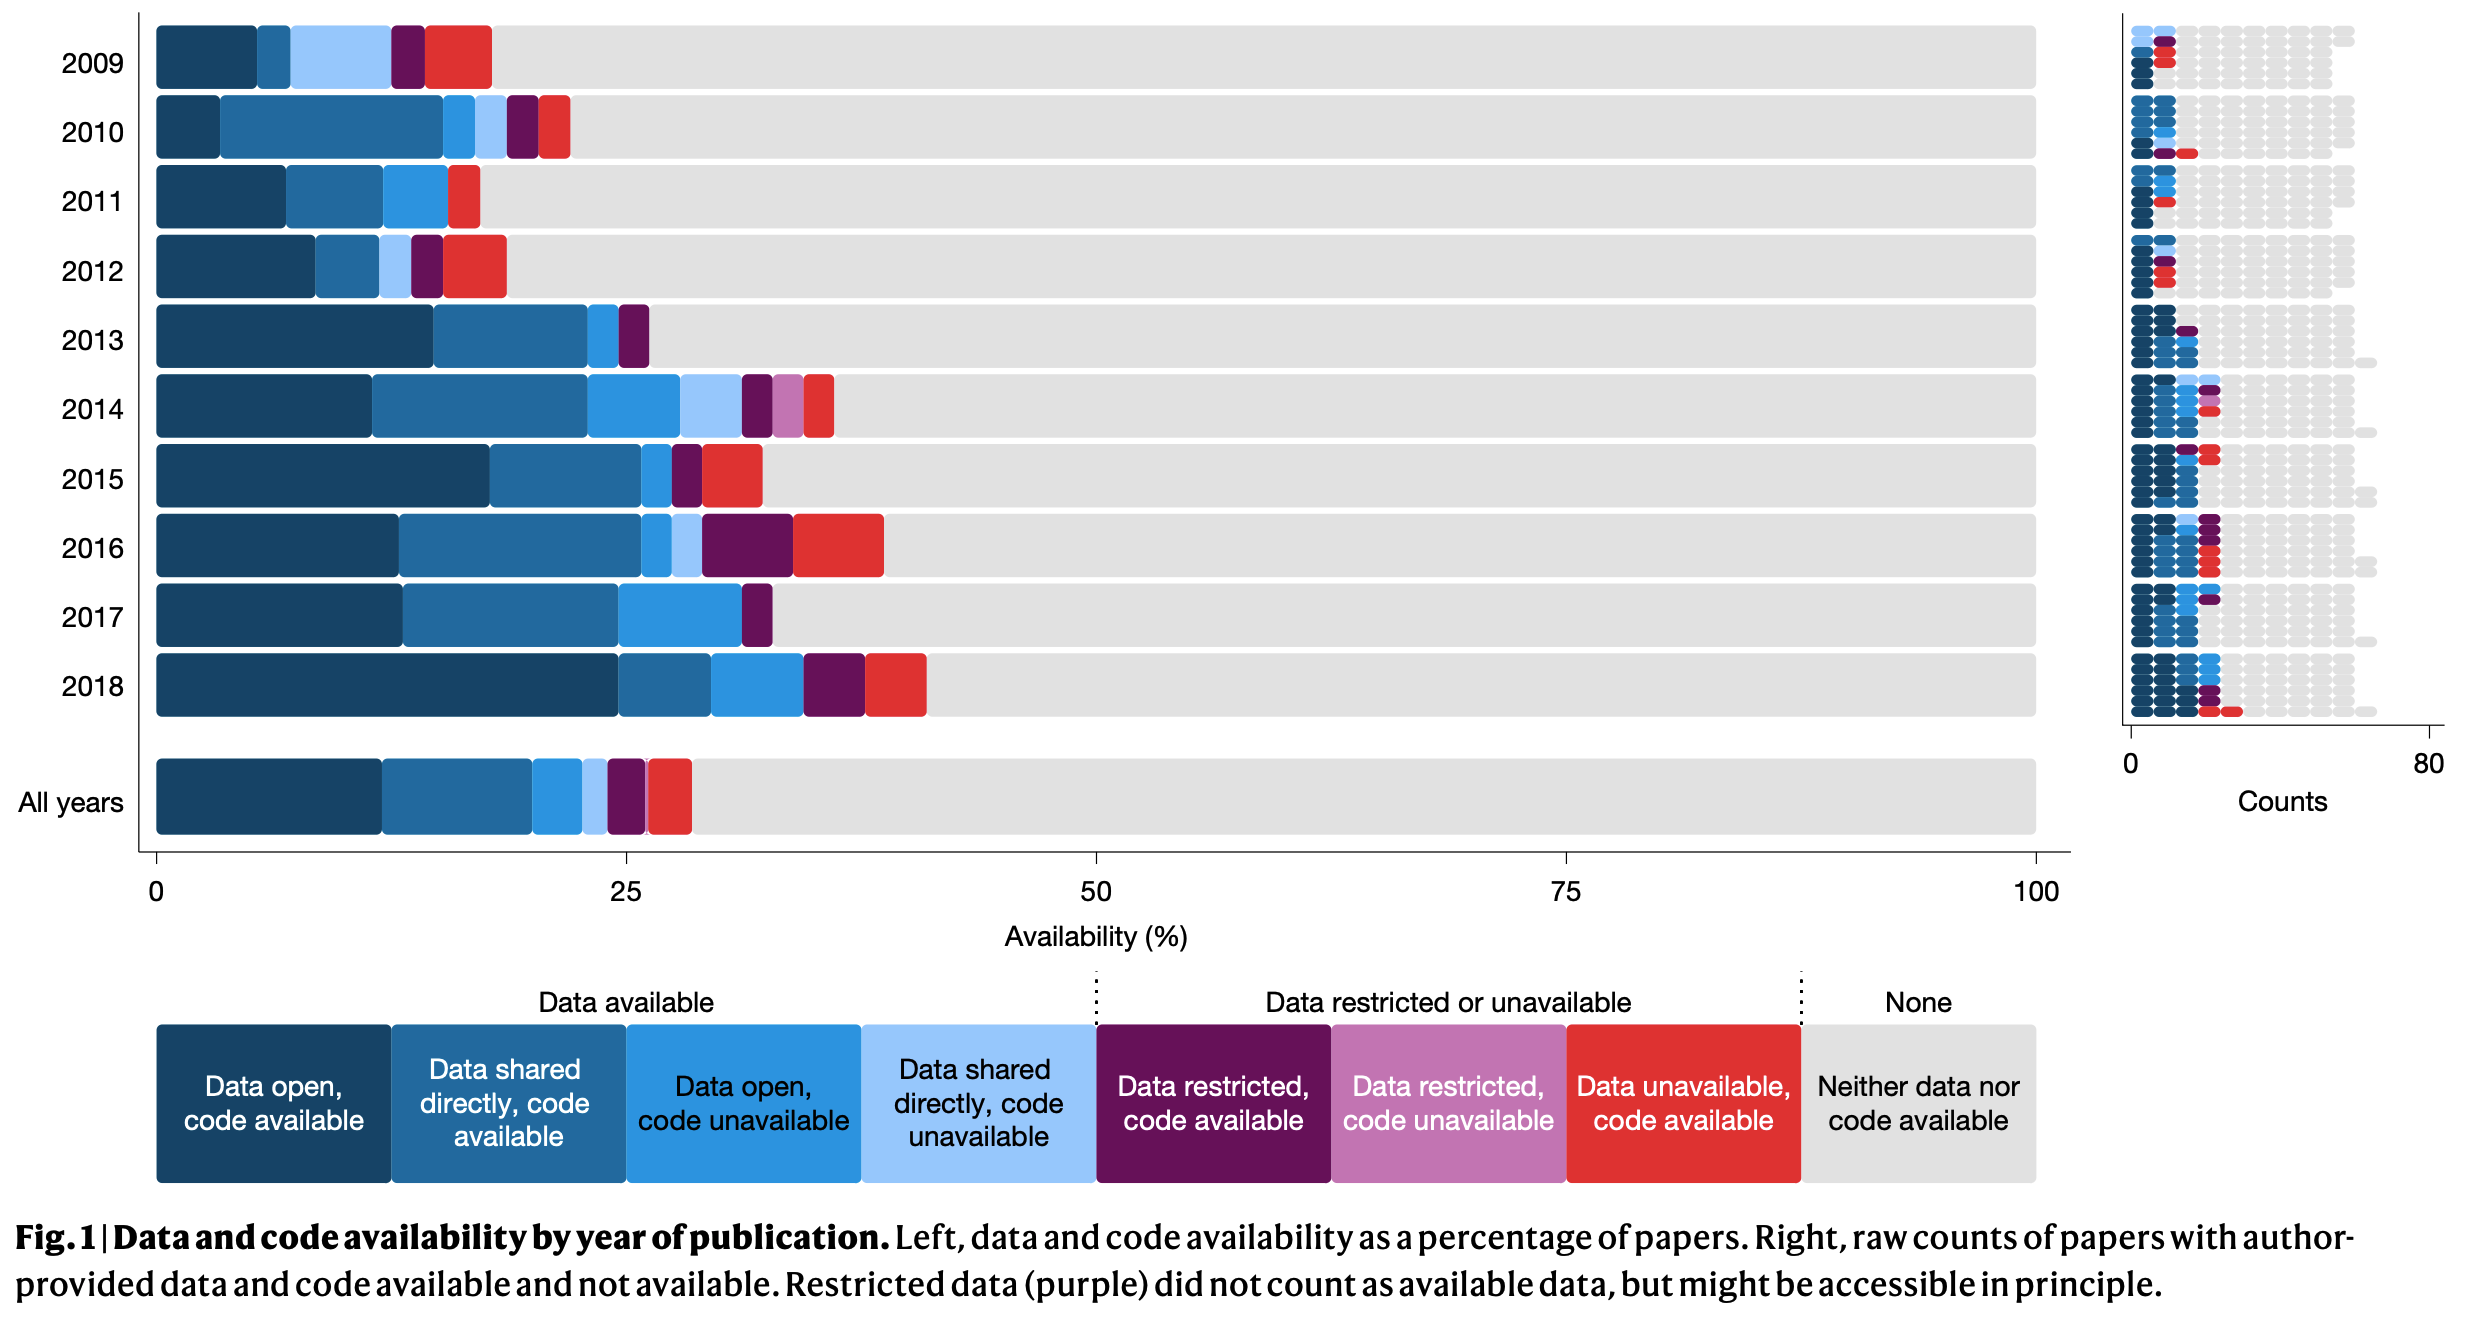
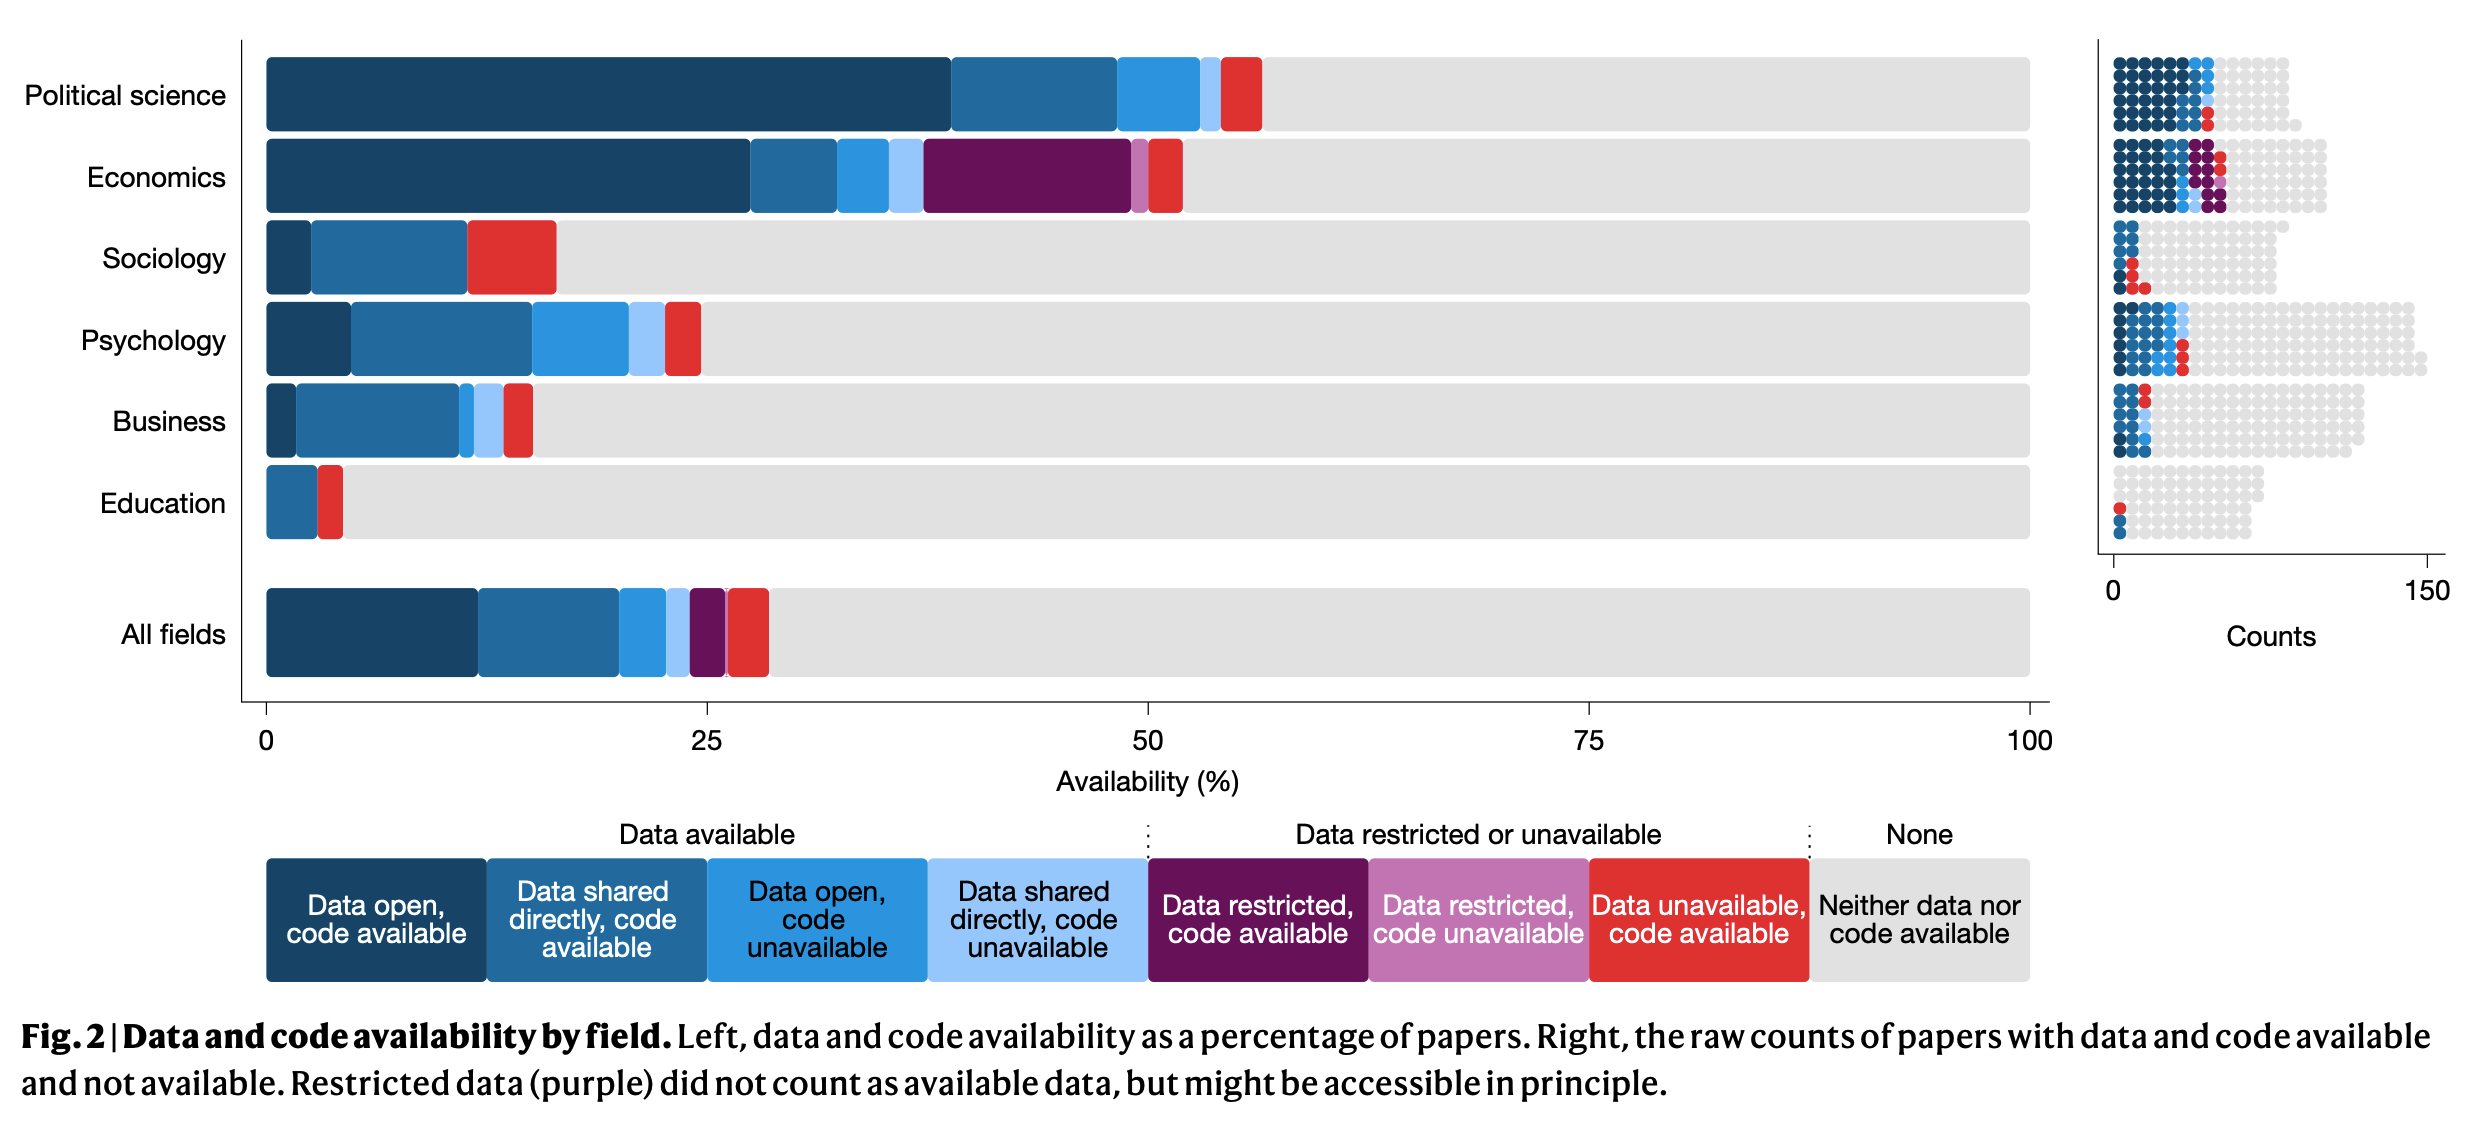
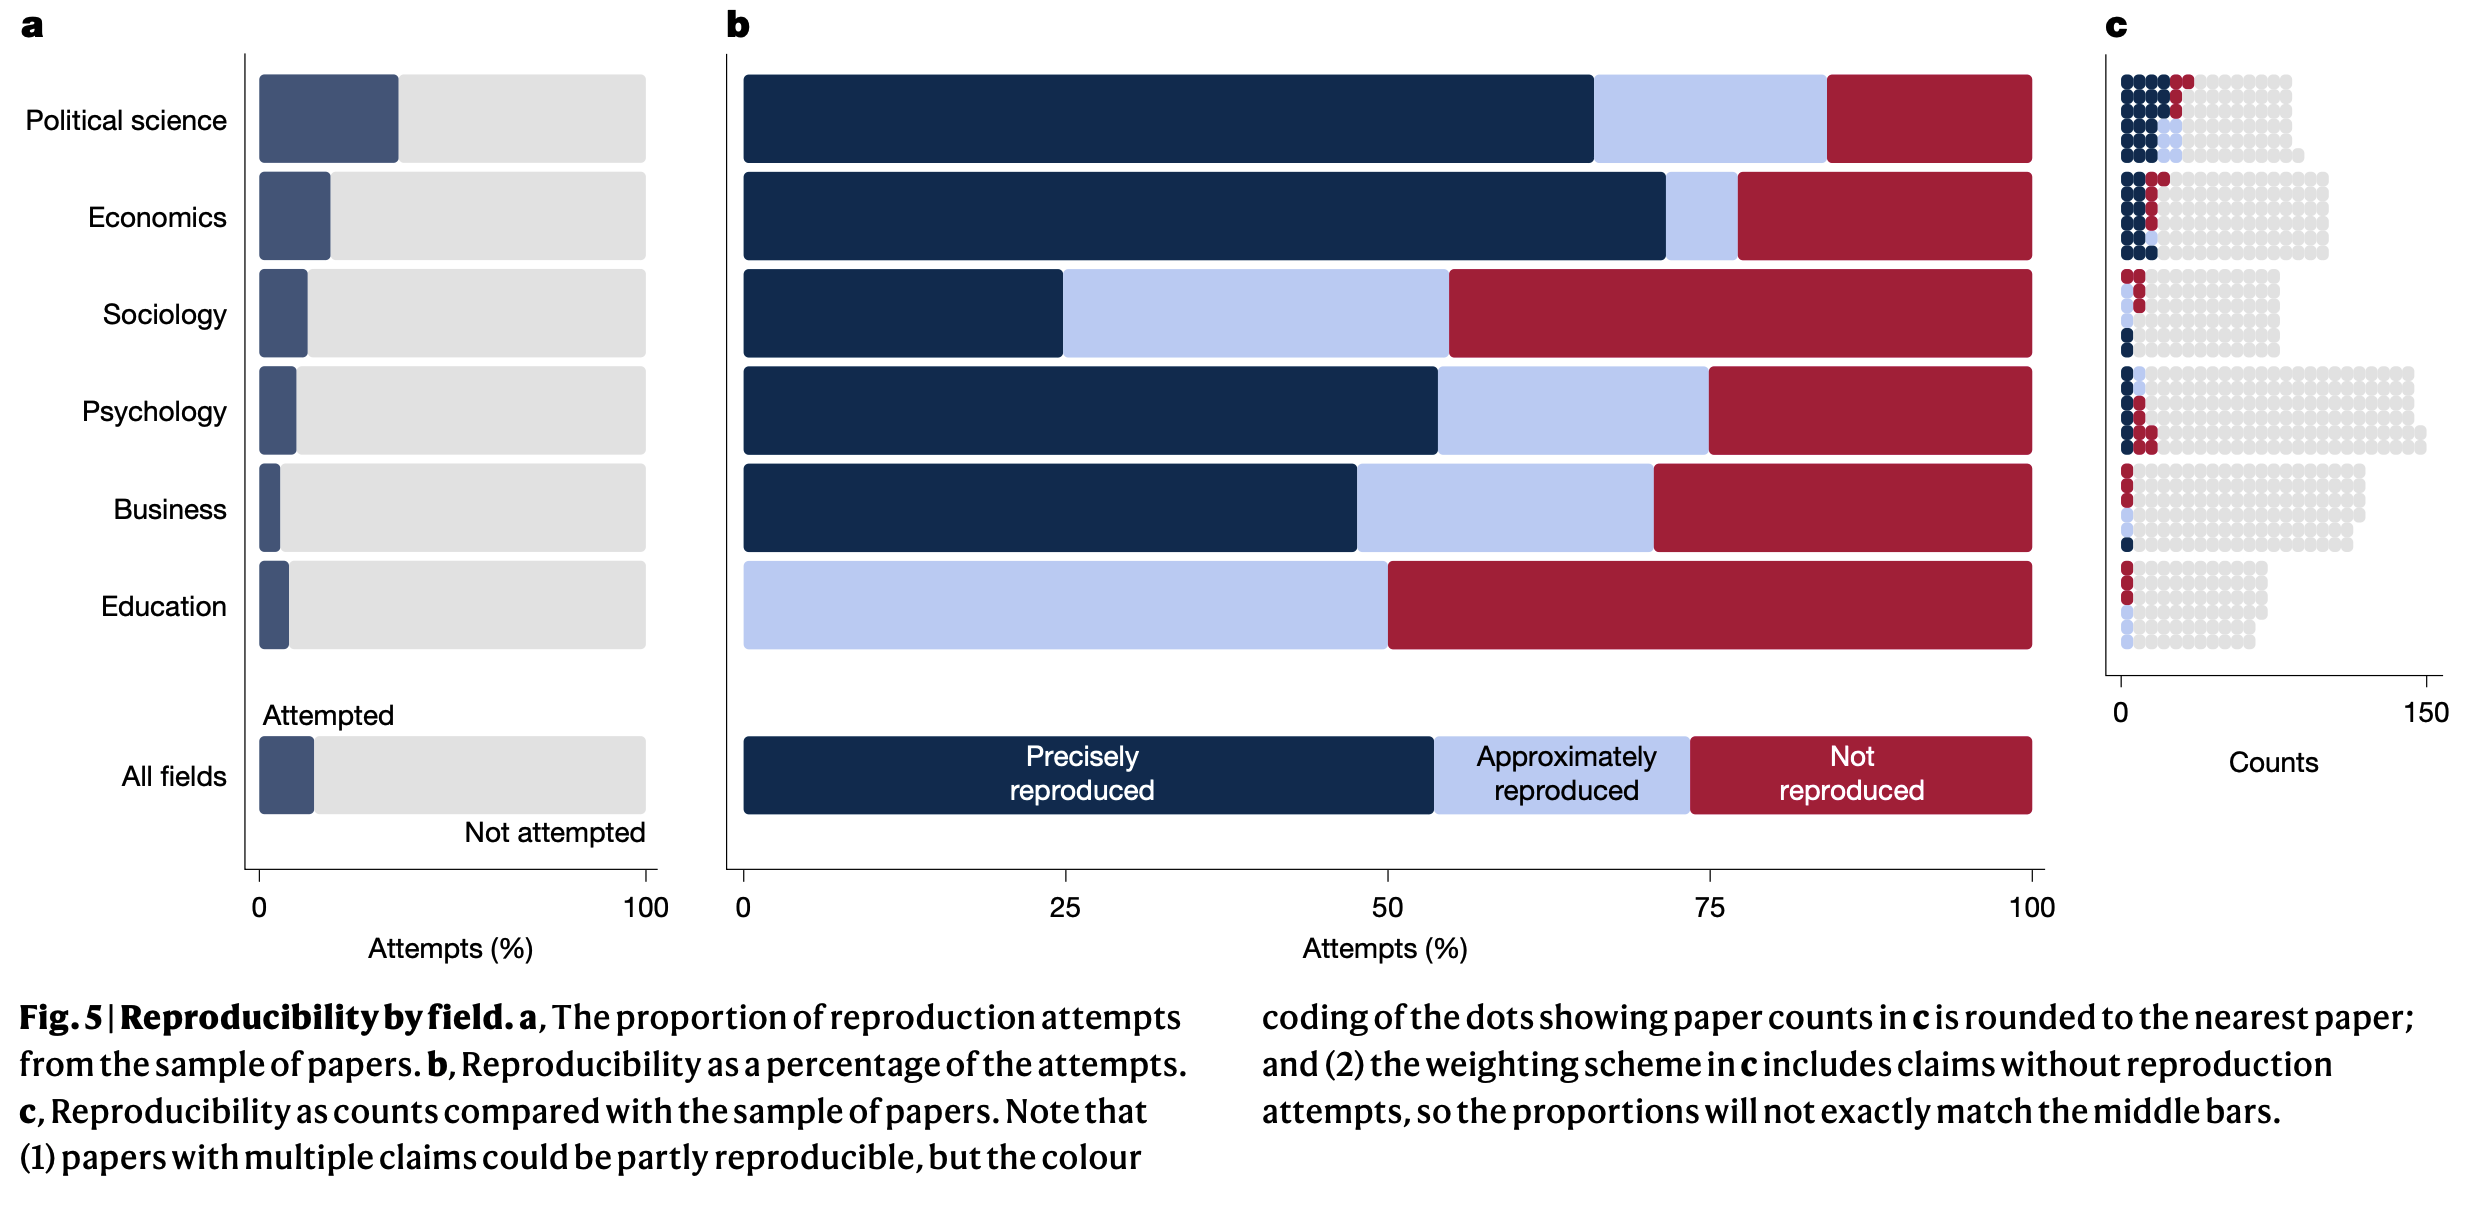
- Reproducibility in many fields is poor

“The first principle is that you must not fool yourself—and you are the easiest person to fool. So you have to be very careful about that. After you’ve not fooled yourself, it’s easy not to fool other scientists.”
Feynman (1974)

Houses of straw, sticks, or

Stone?

What’s your “bus number”?
- Could your colleagues pick up where you left off?
- Could your adviser?

Capture the workflow
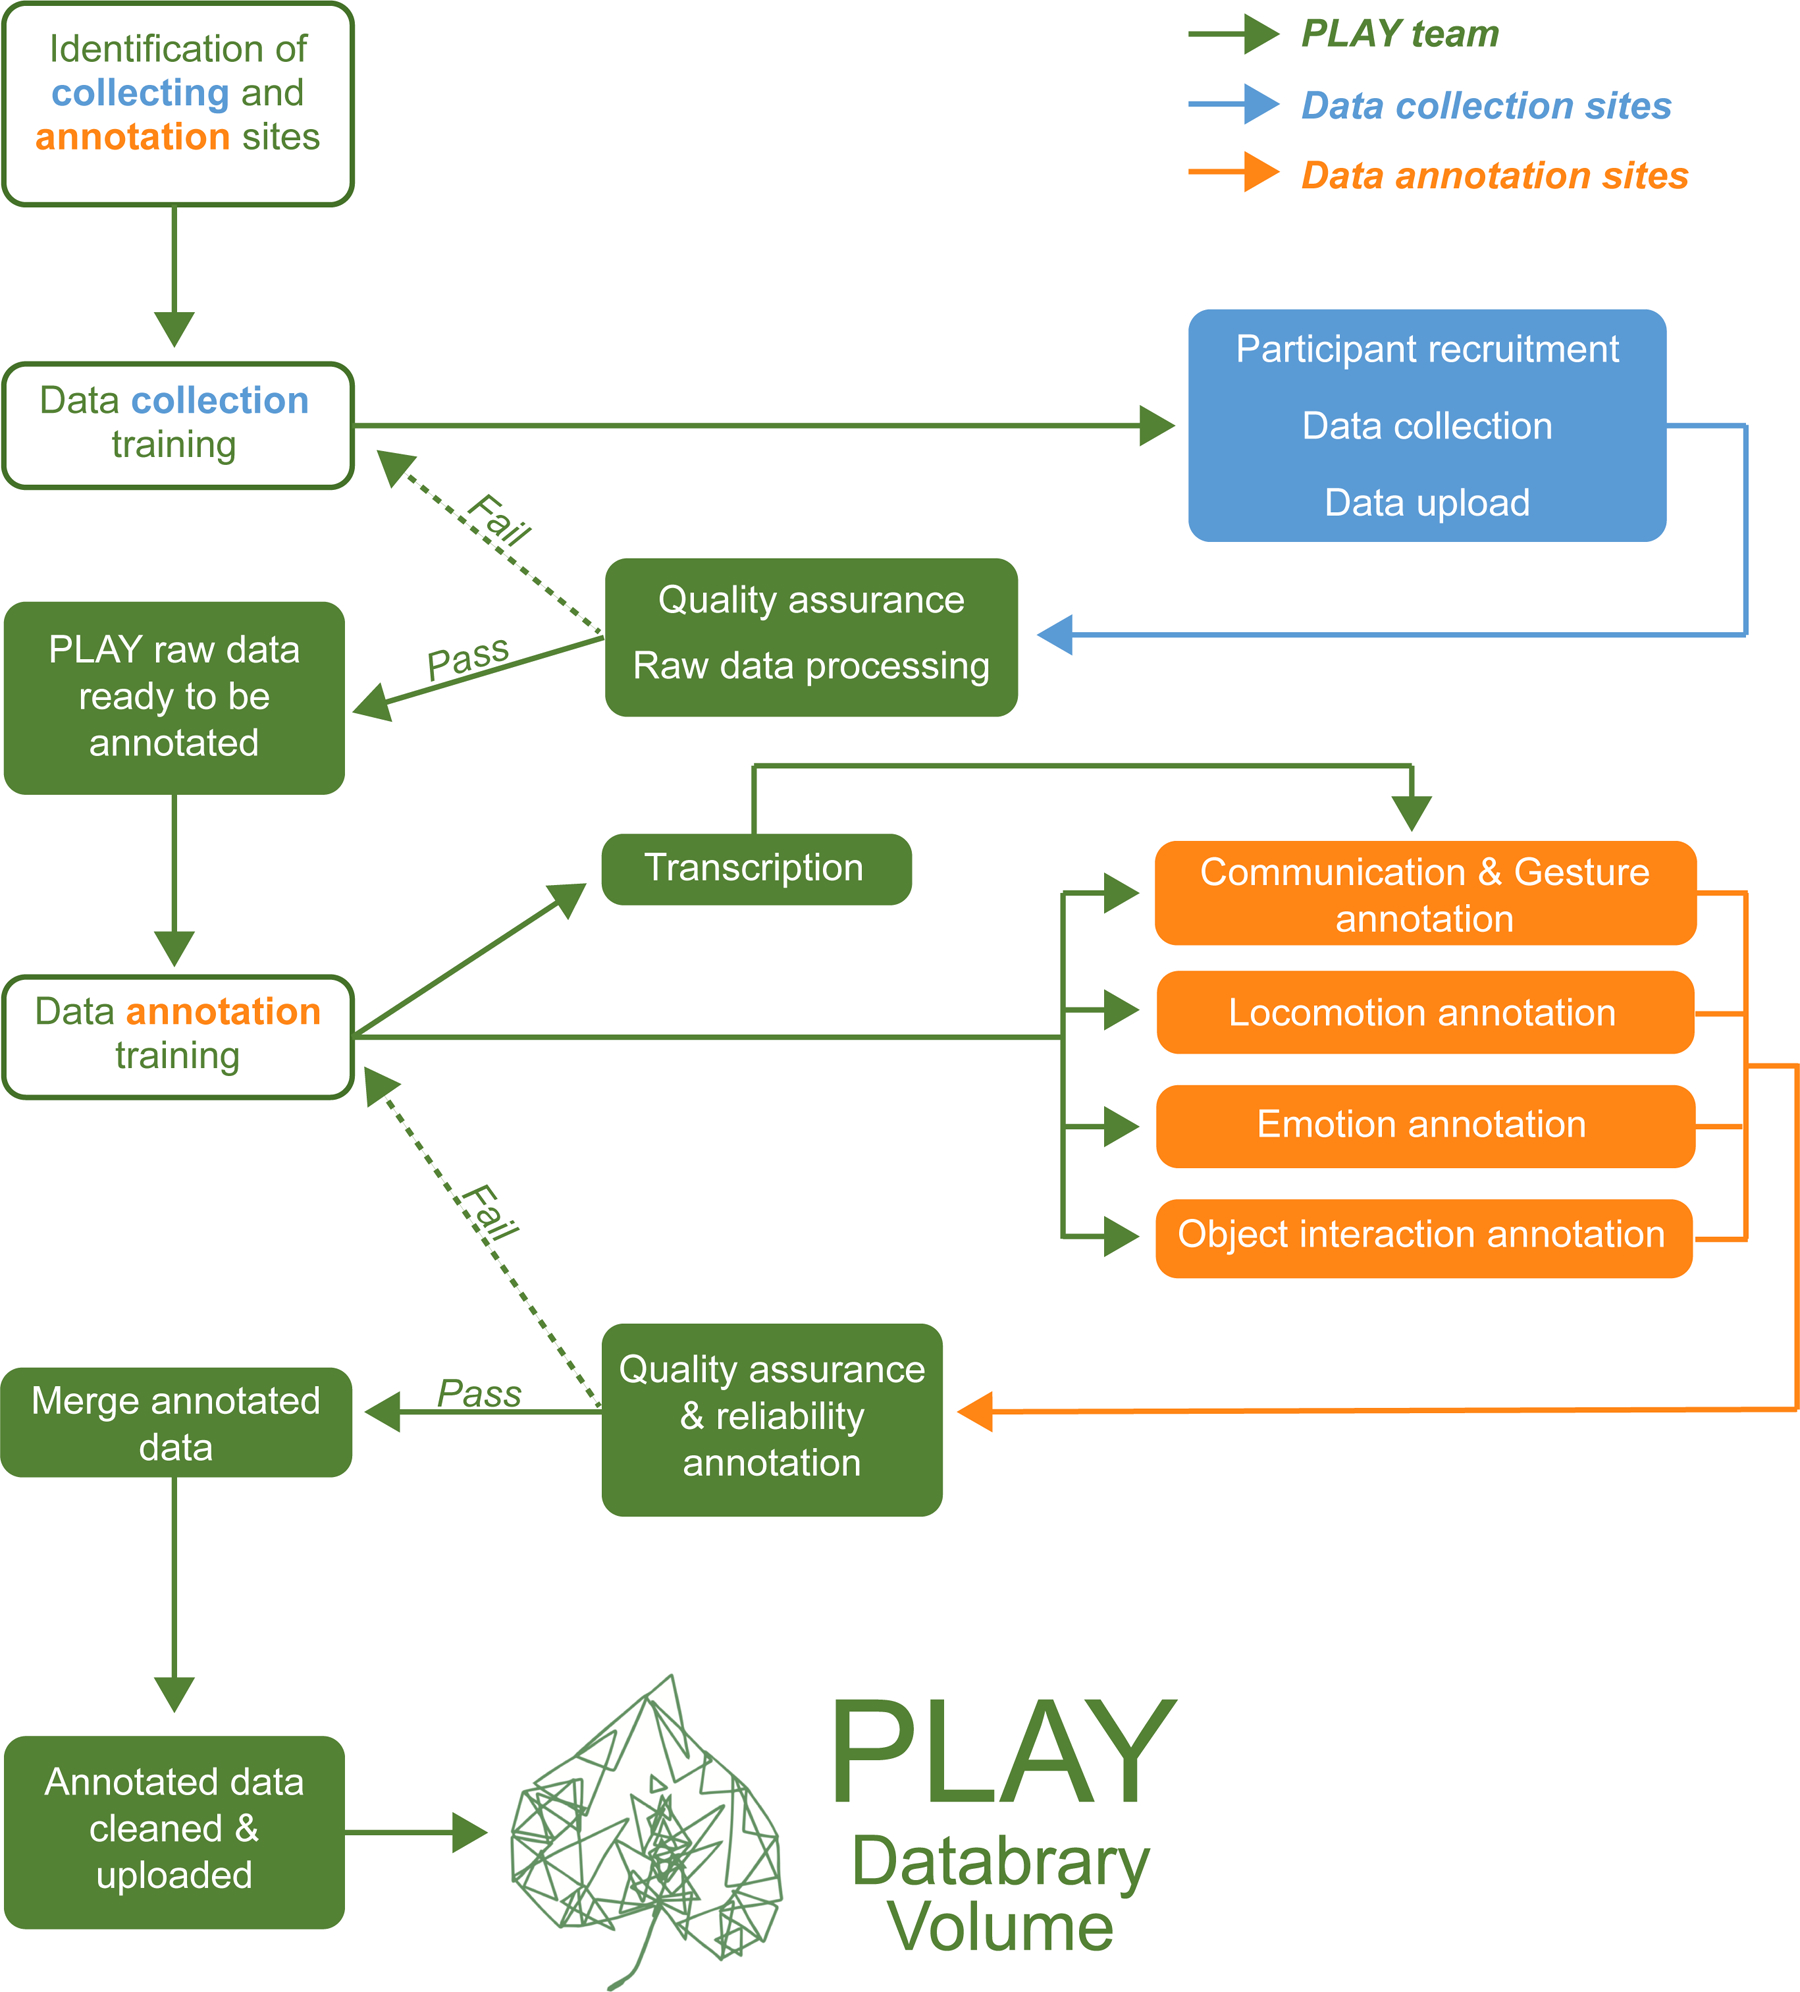
- Humans
- Checklists, Standard Operating Procedures (SOPs), Protocols
- Quality Assurance (QA) checks

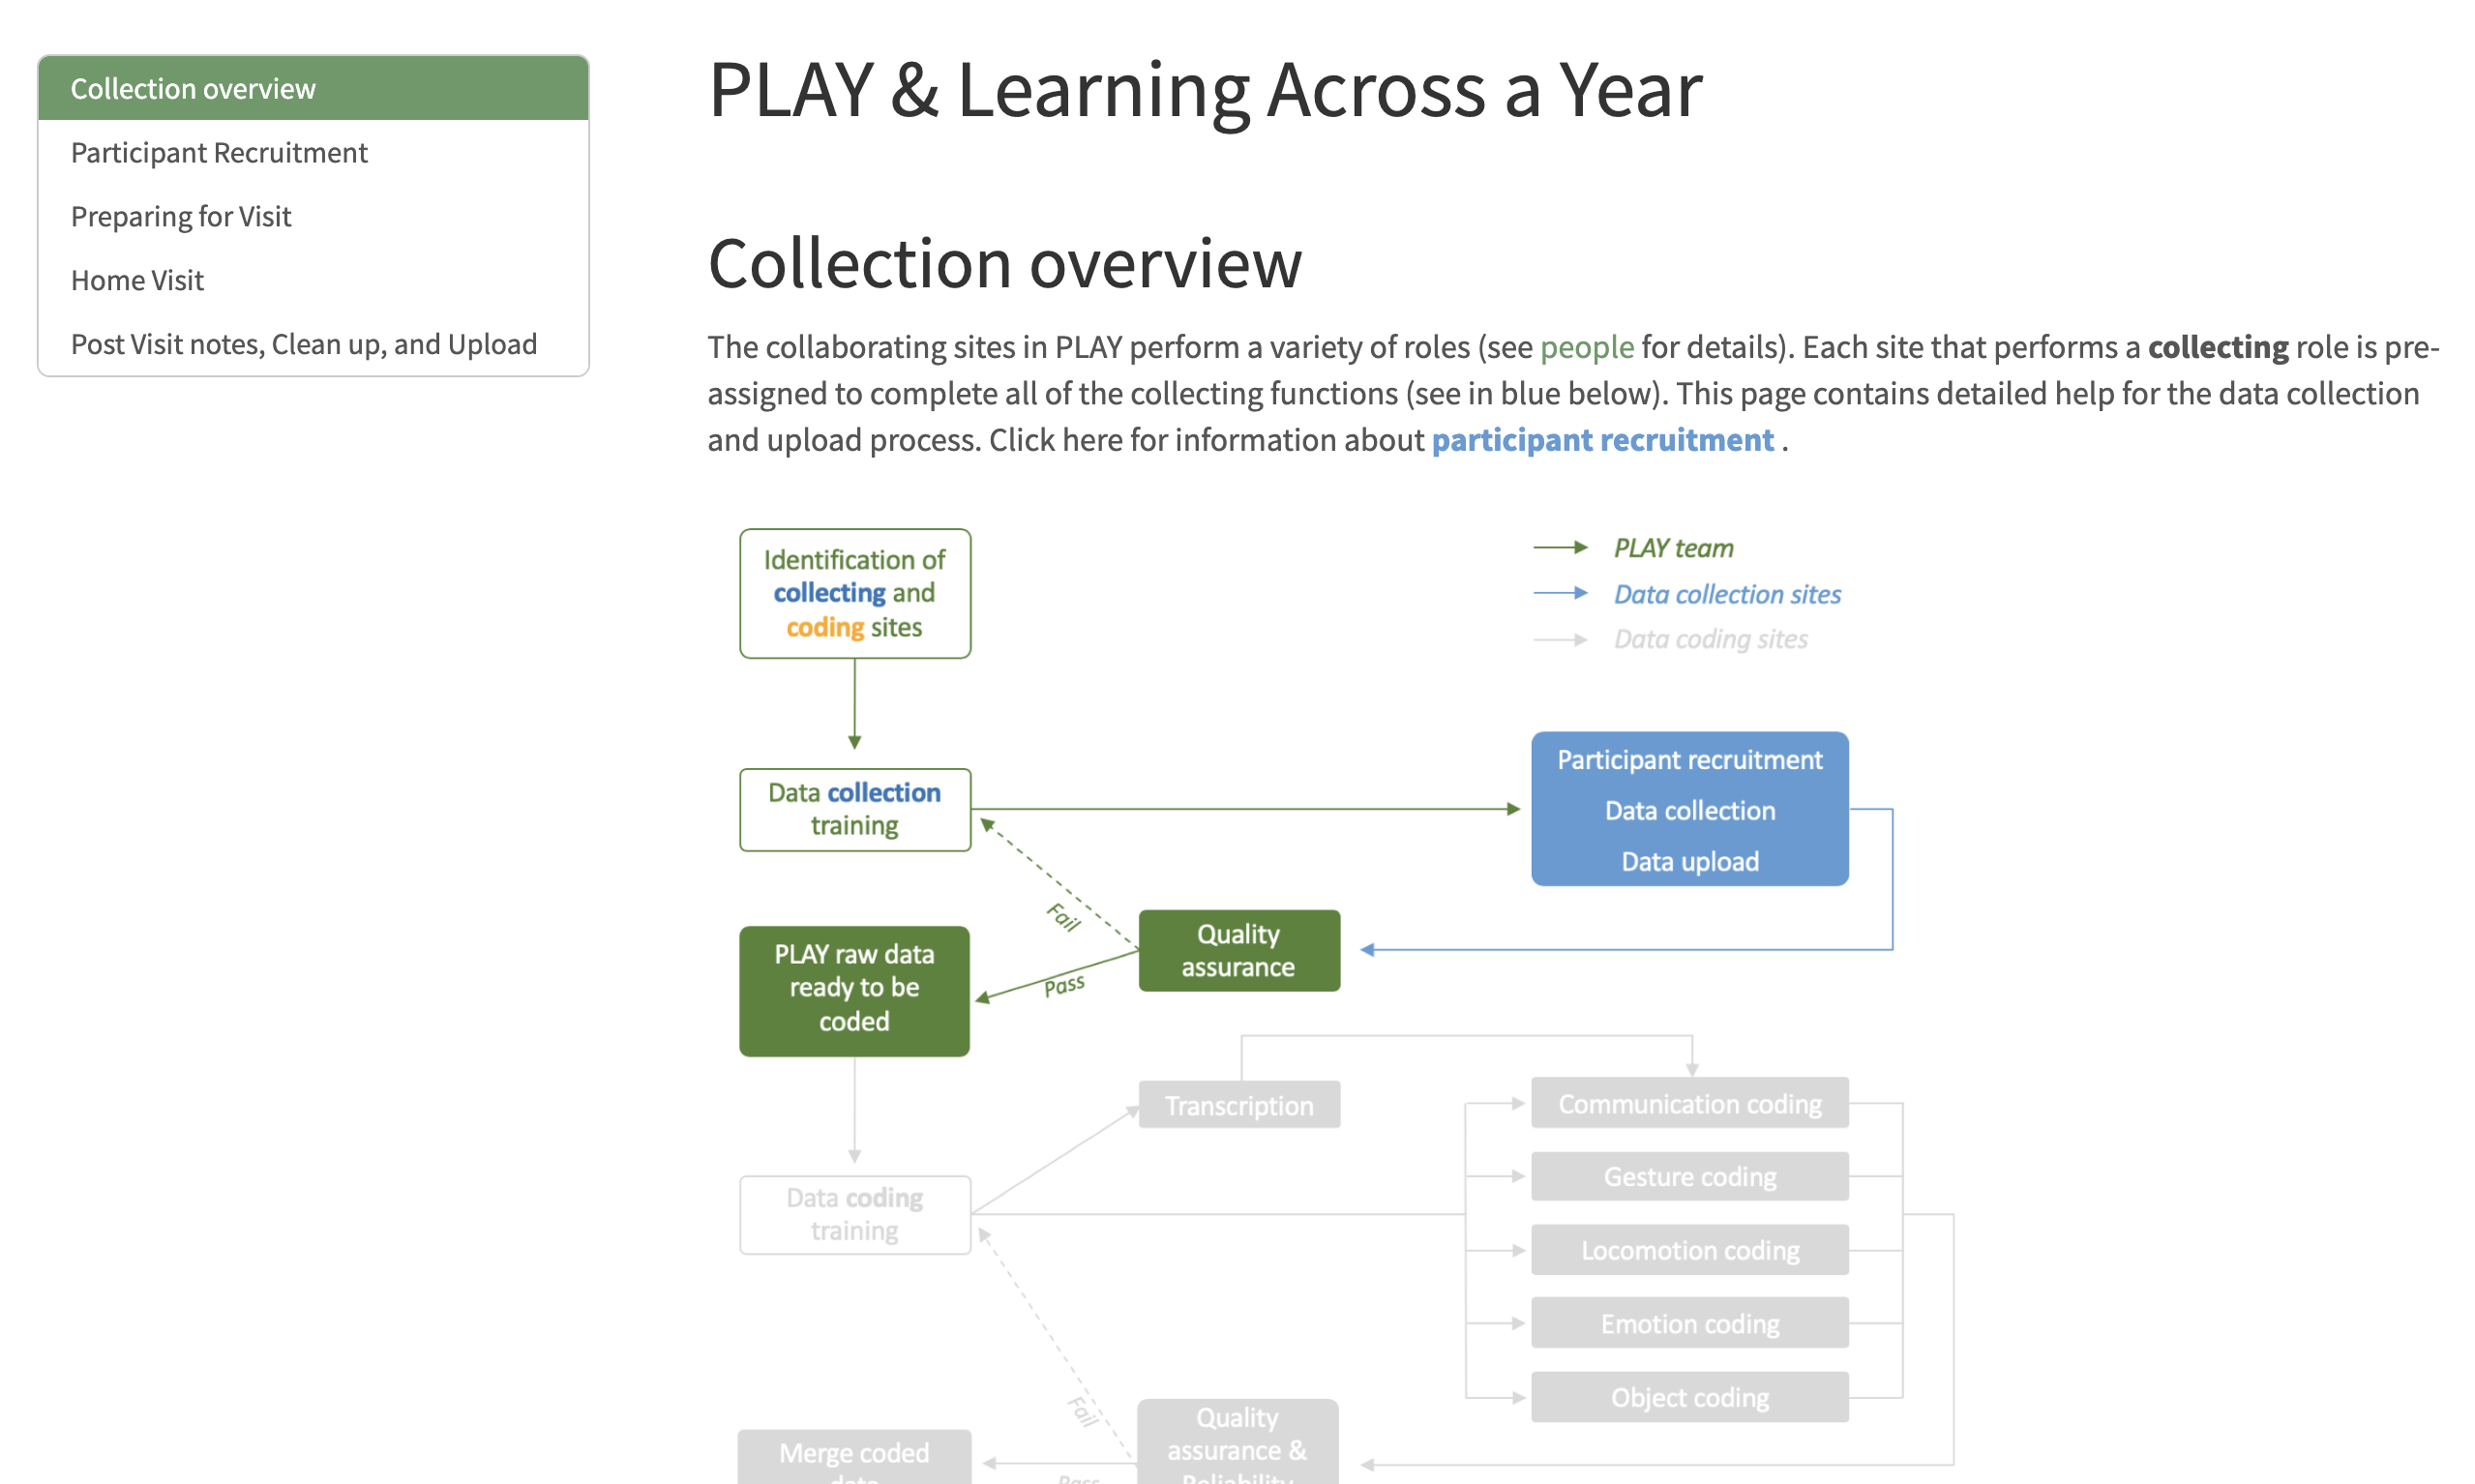
Share your workflow


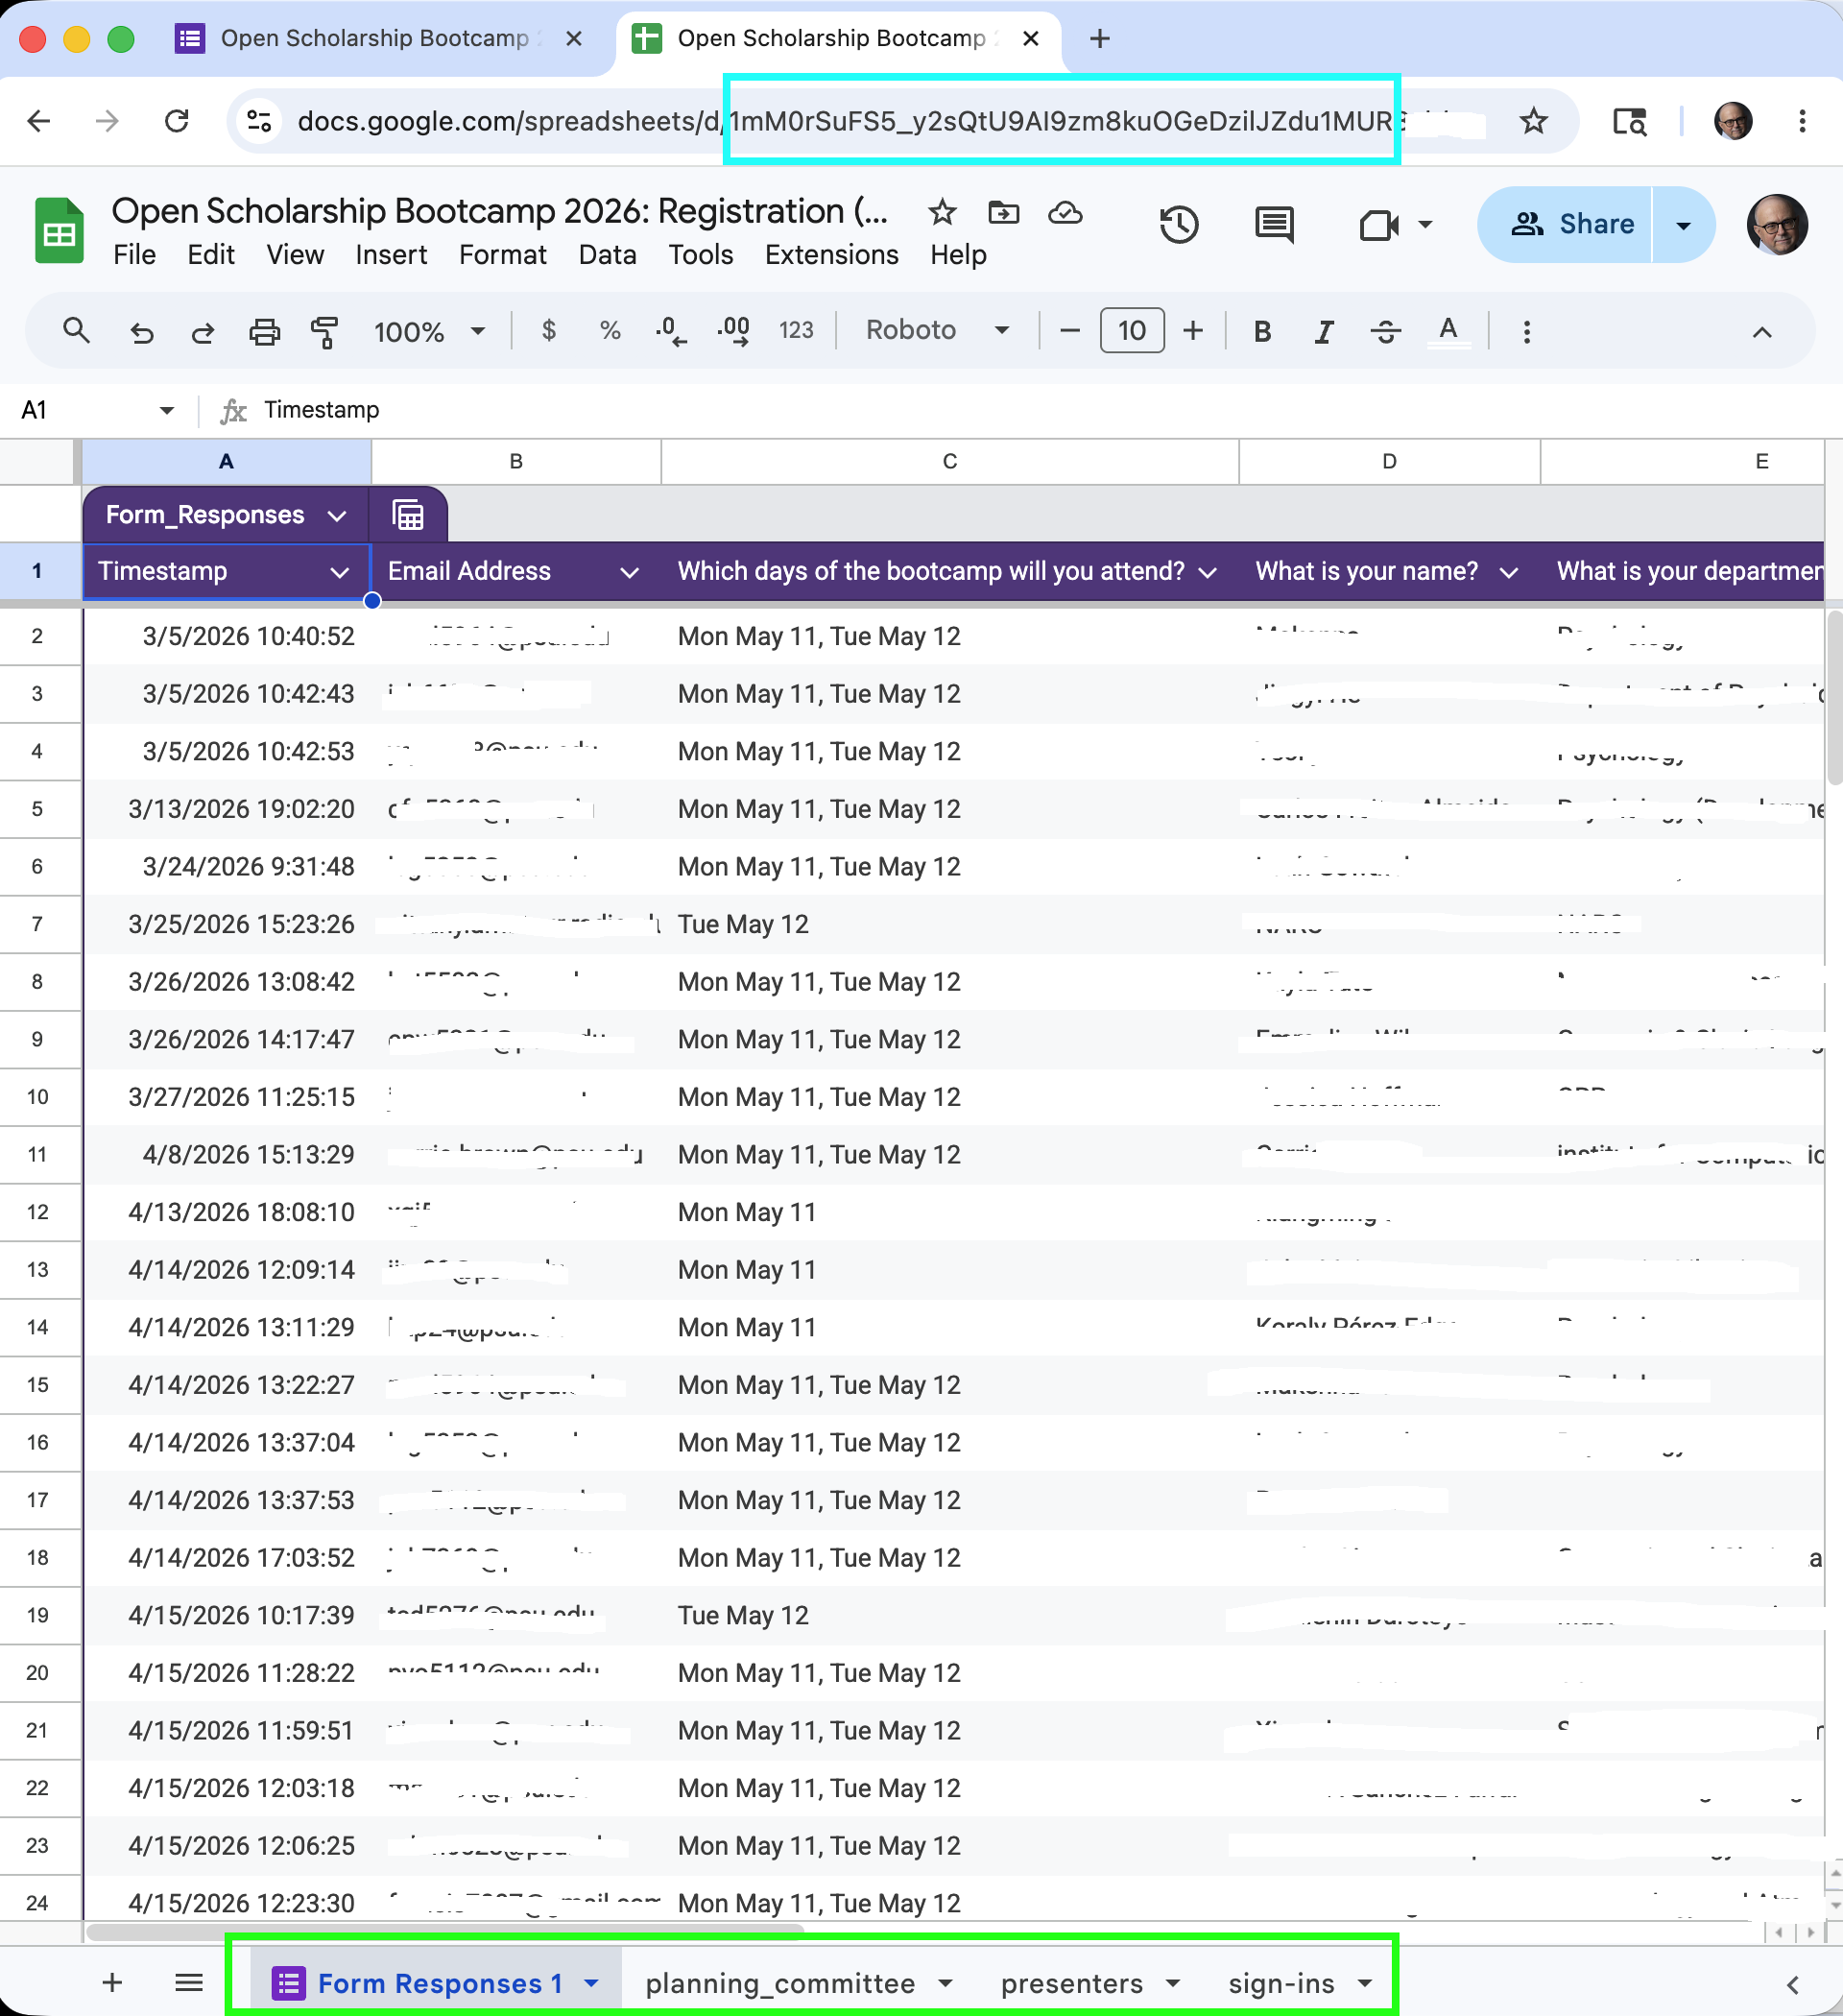
Gathering: Google Forms
- Google Form exports to Google Sheet
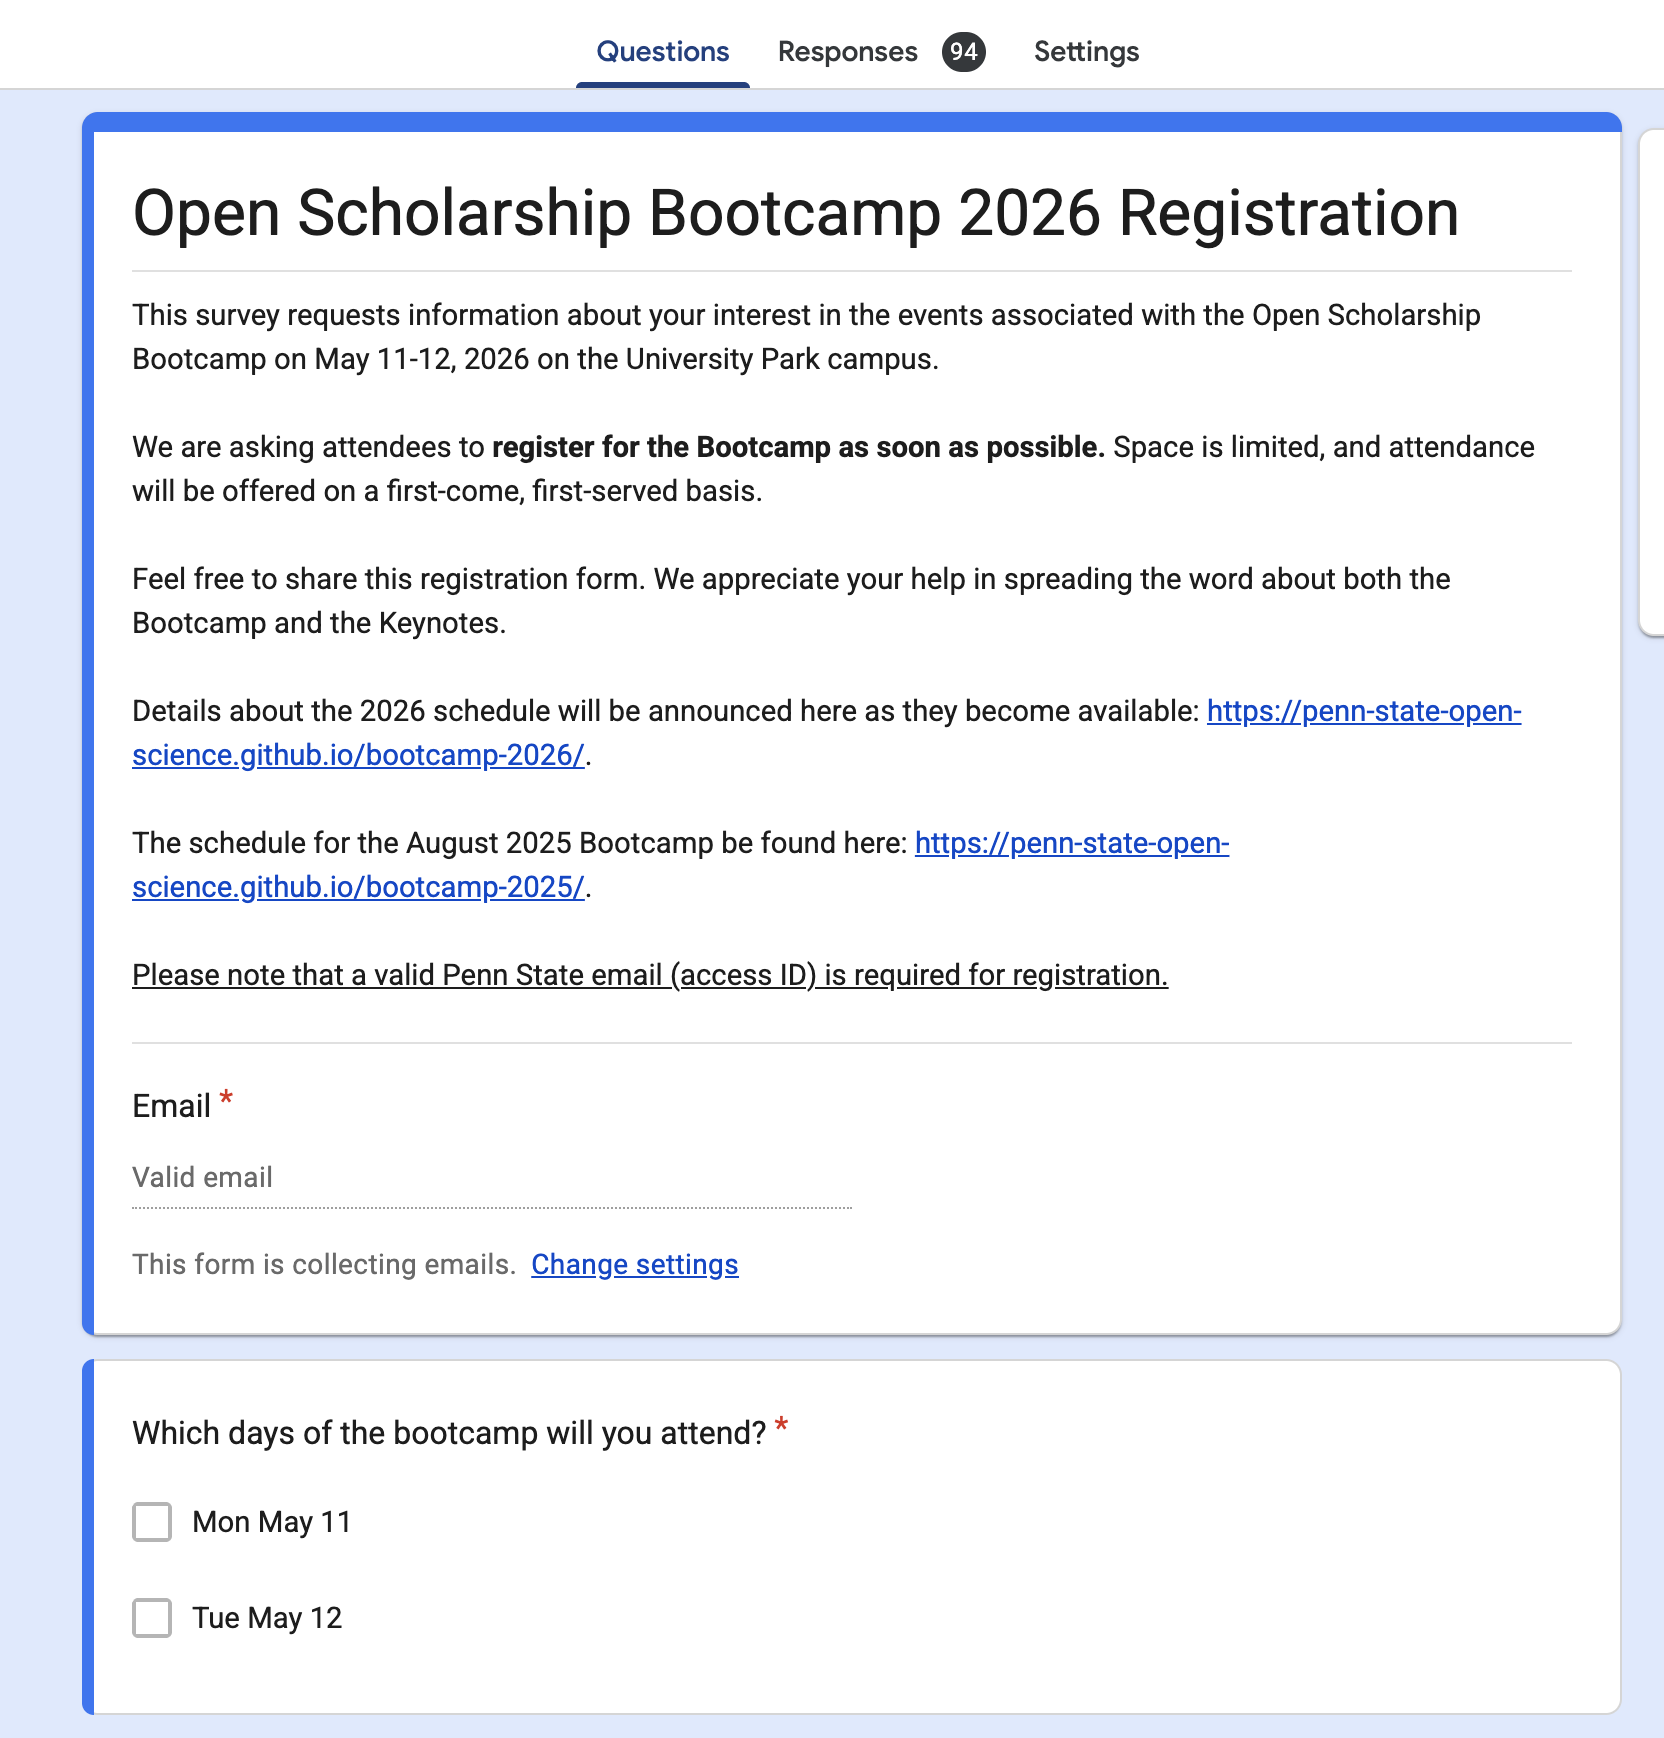
Gathering: Google Forms
- Google Sheet linked to Google account(s)
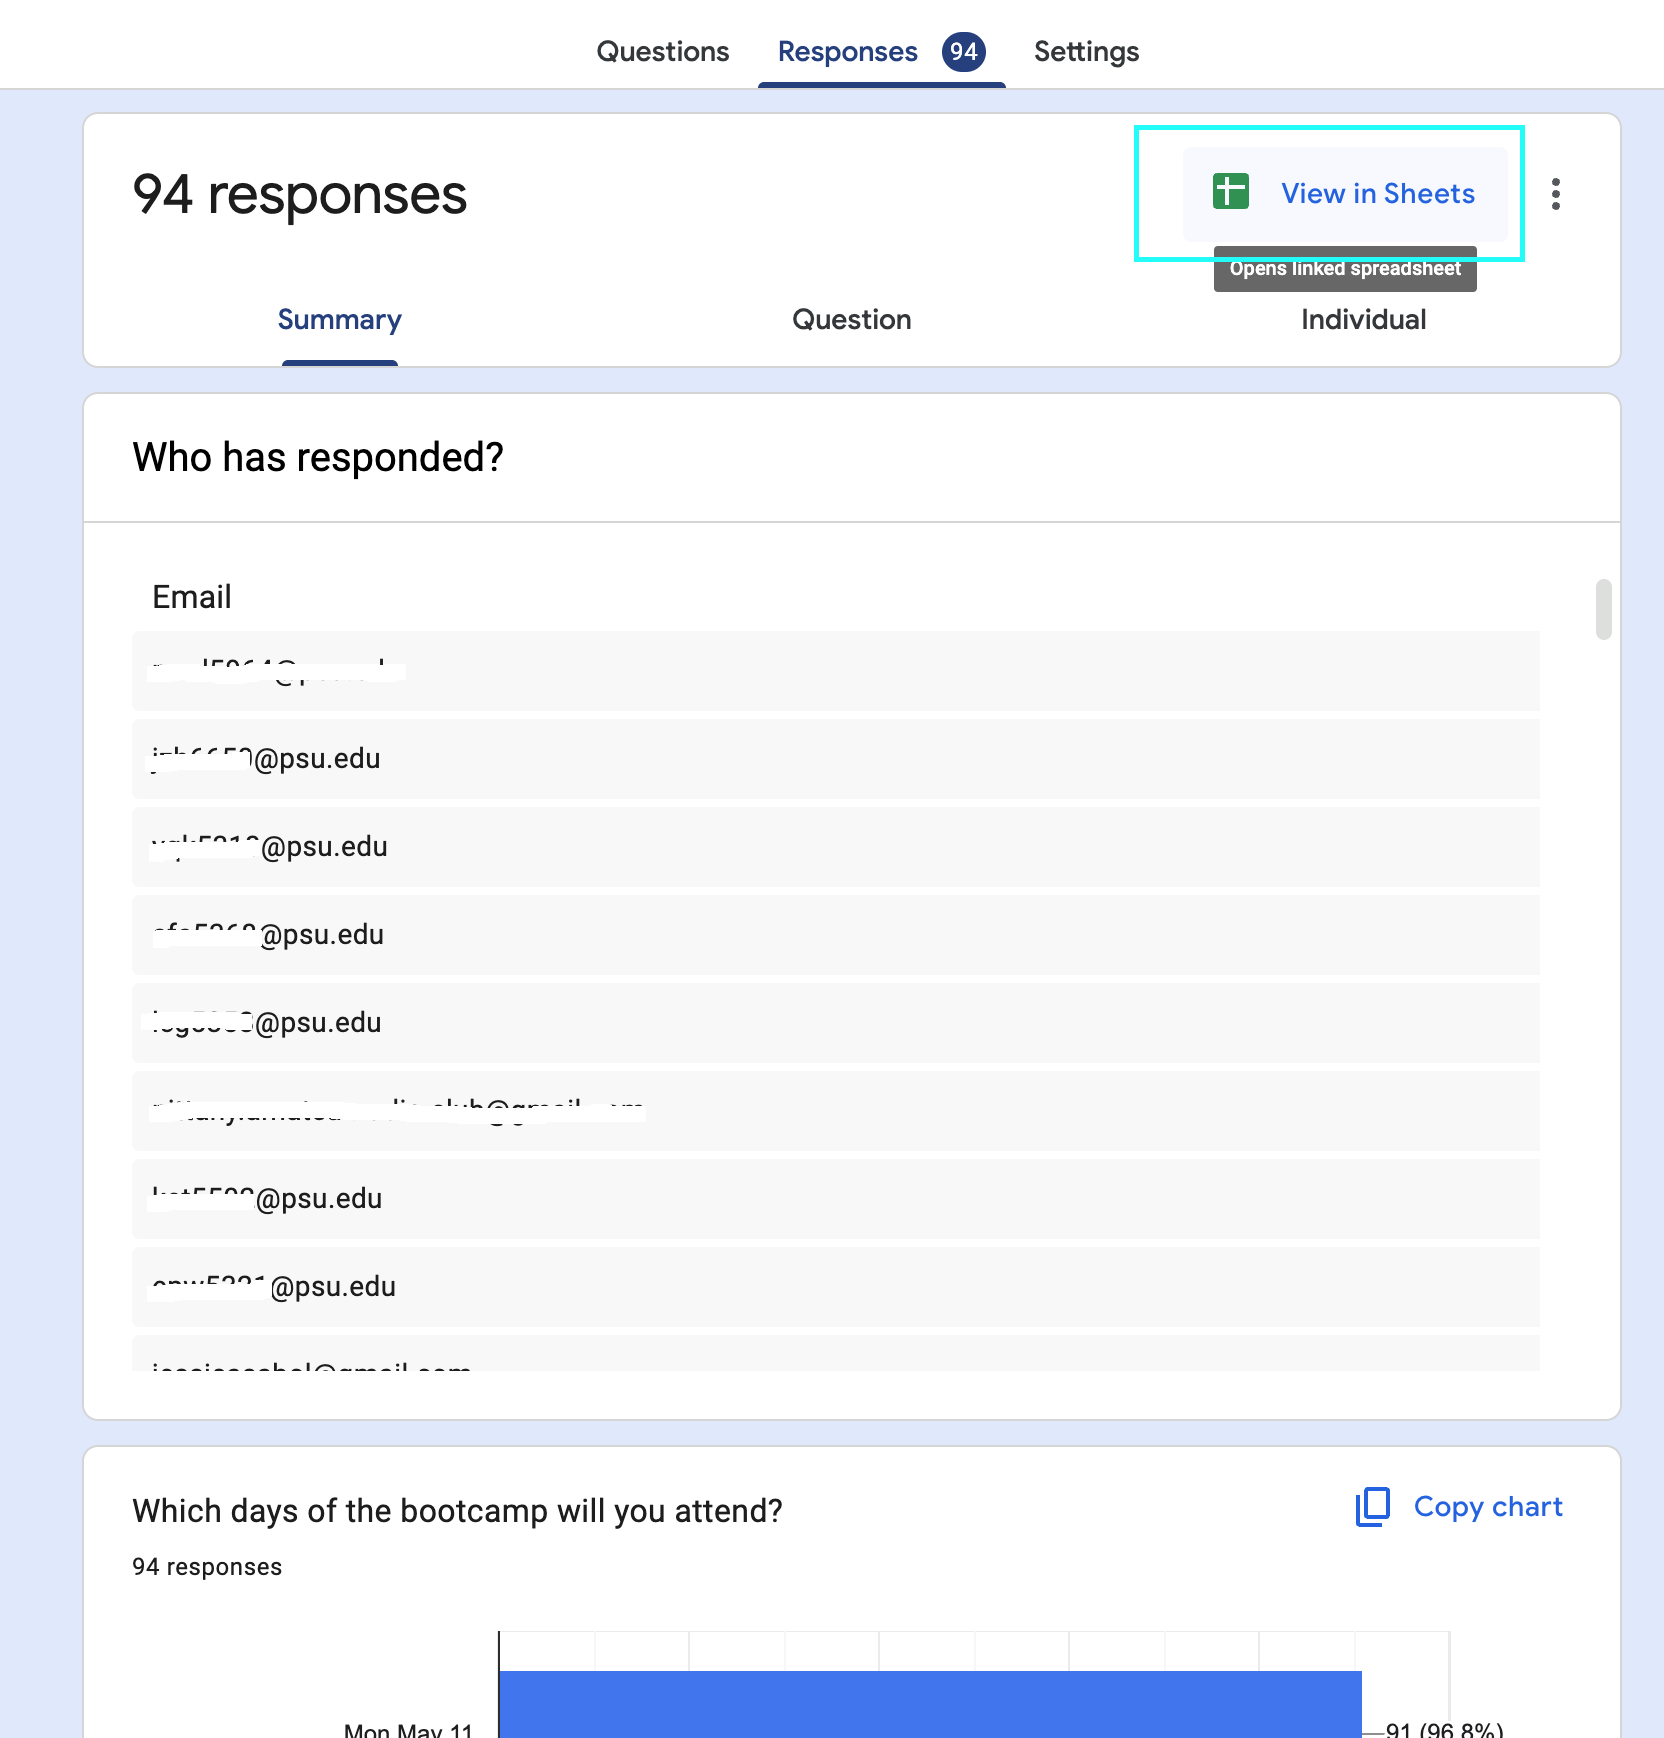
Gathering: Google Forms
- Google Sheet has ID, file name, maybe multiple sheets
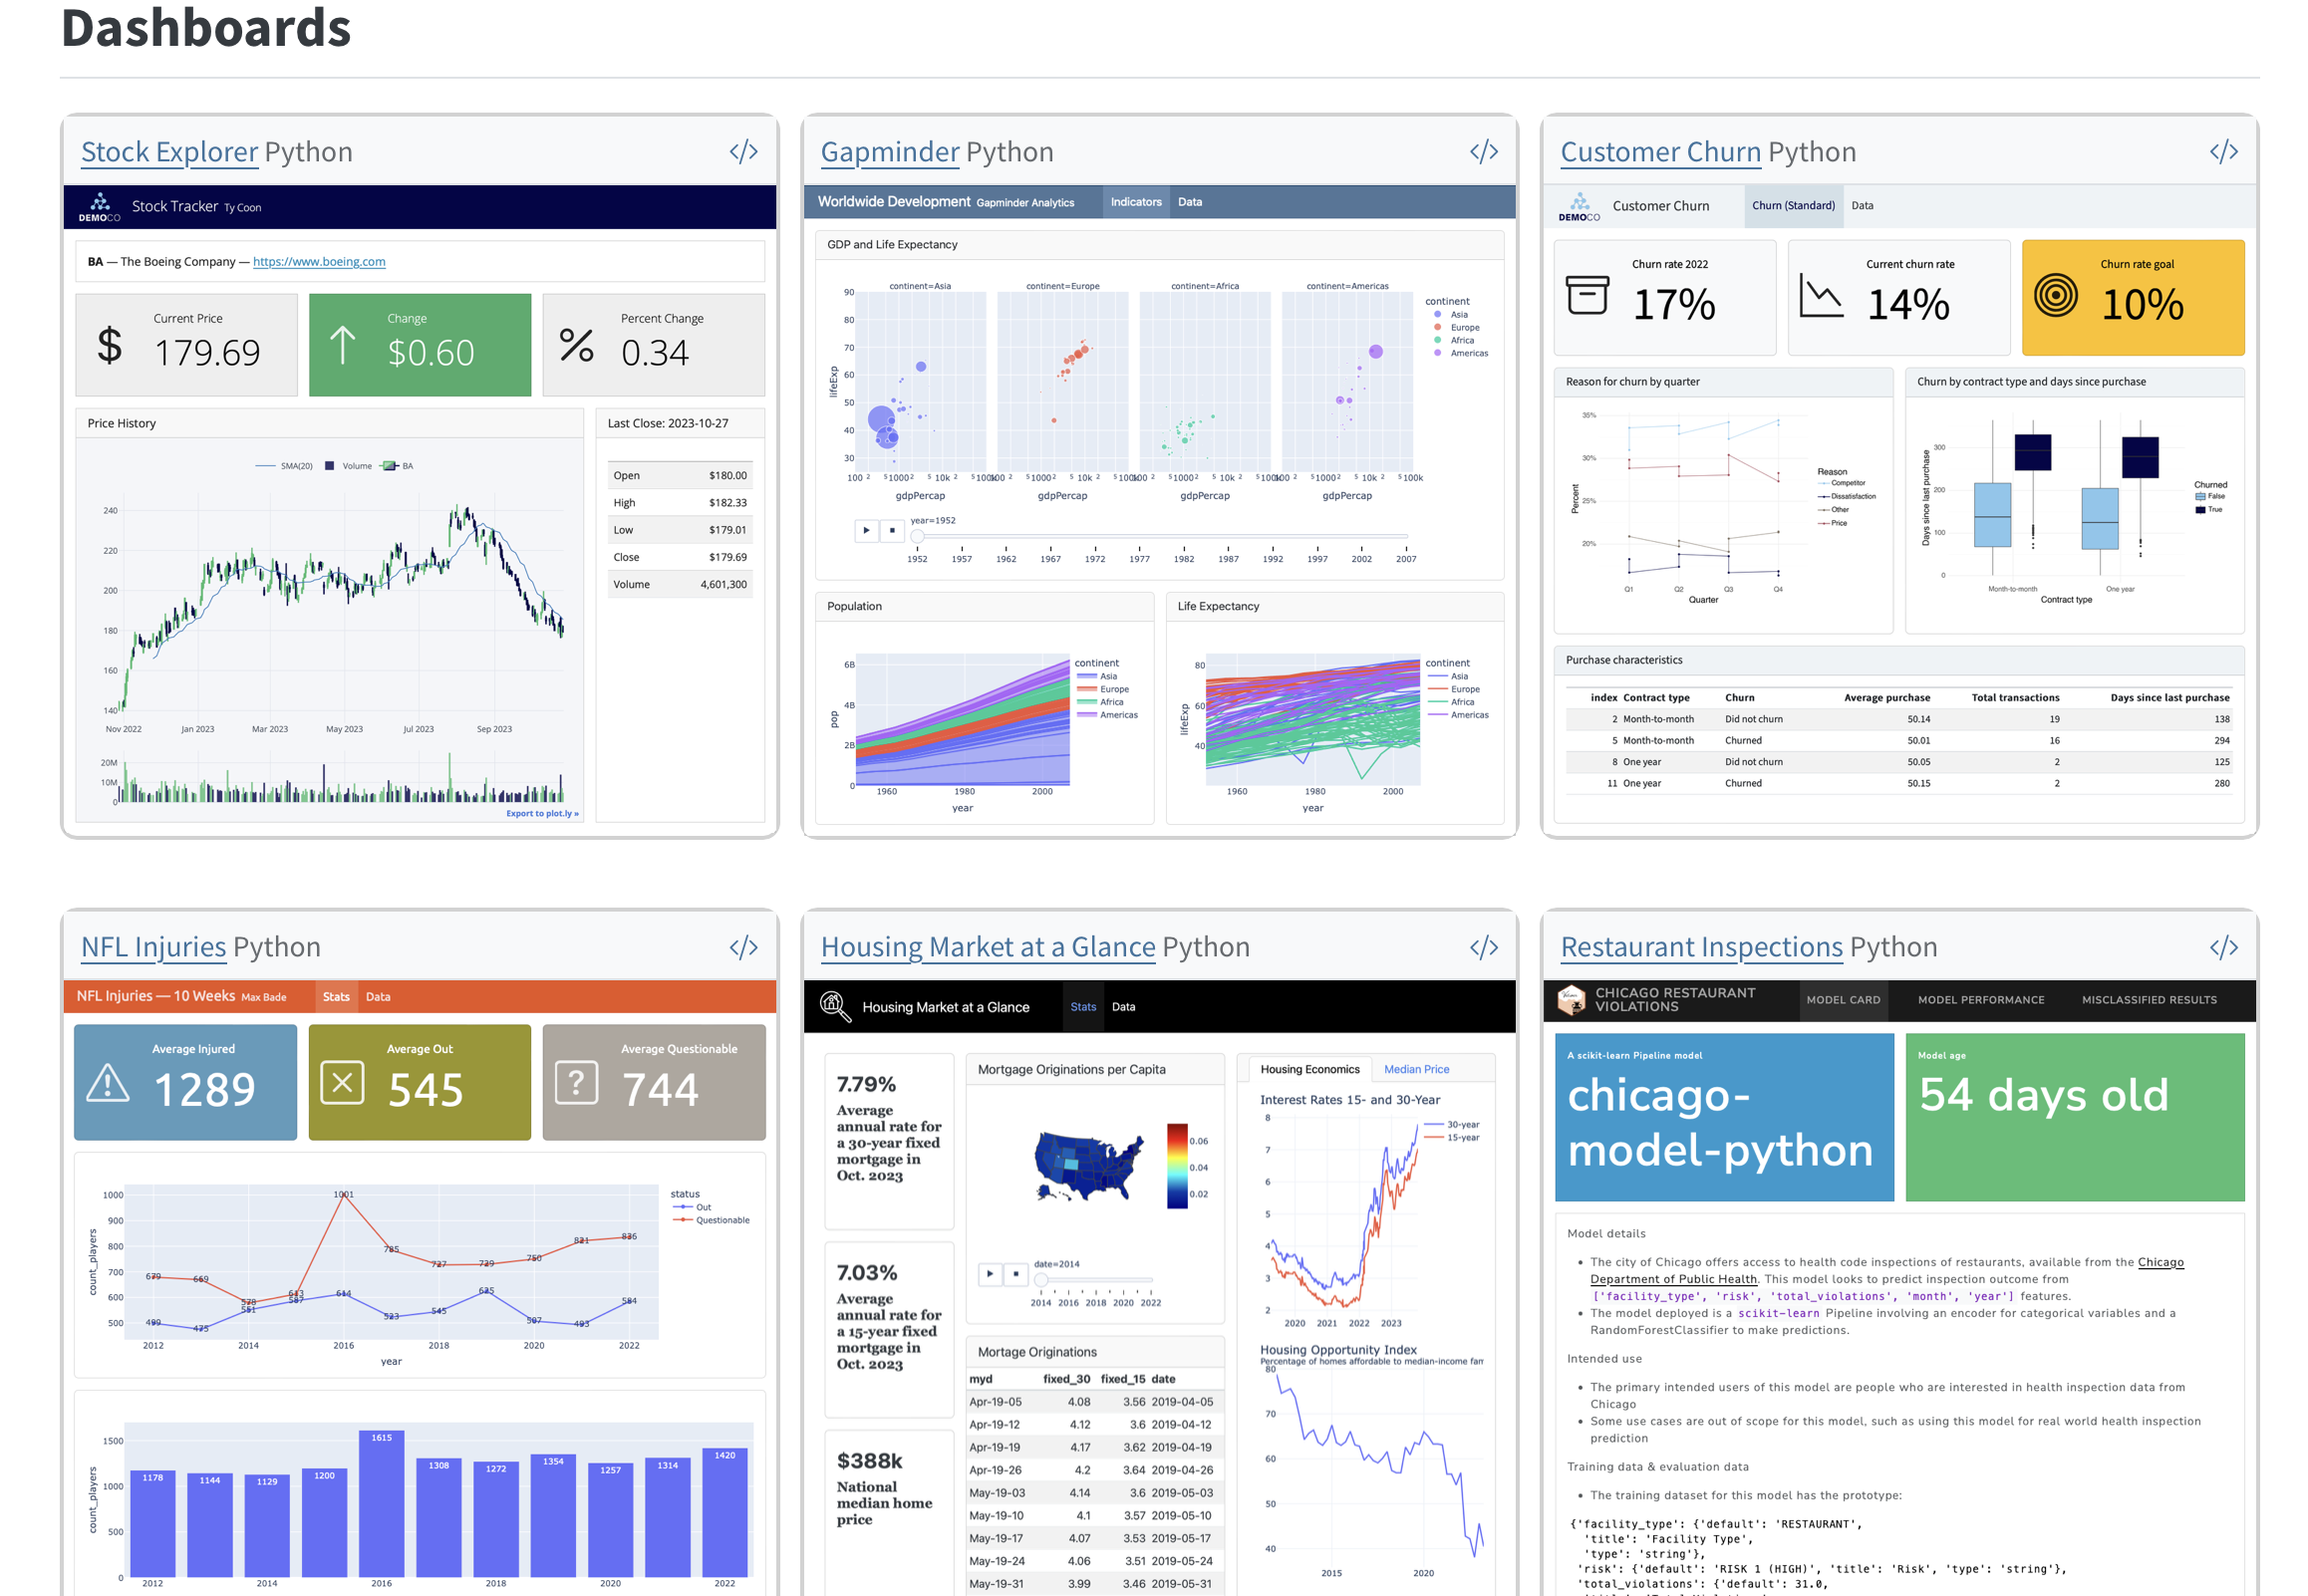
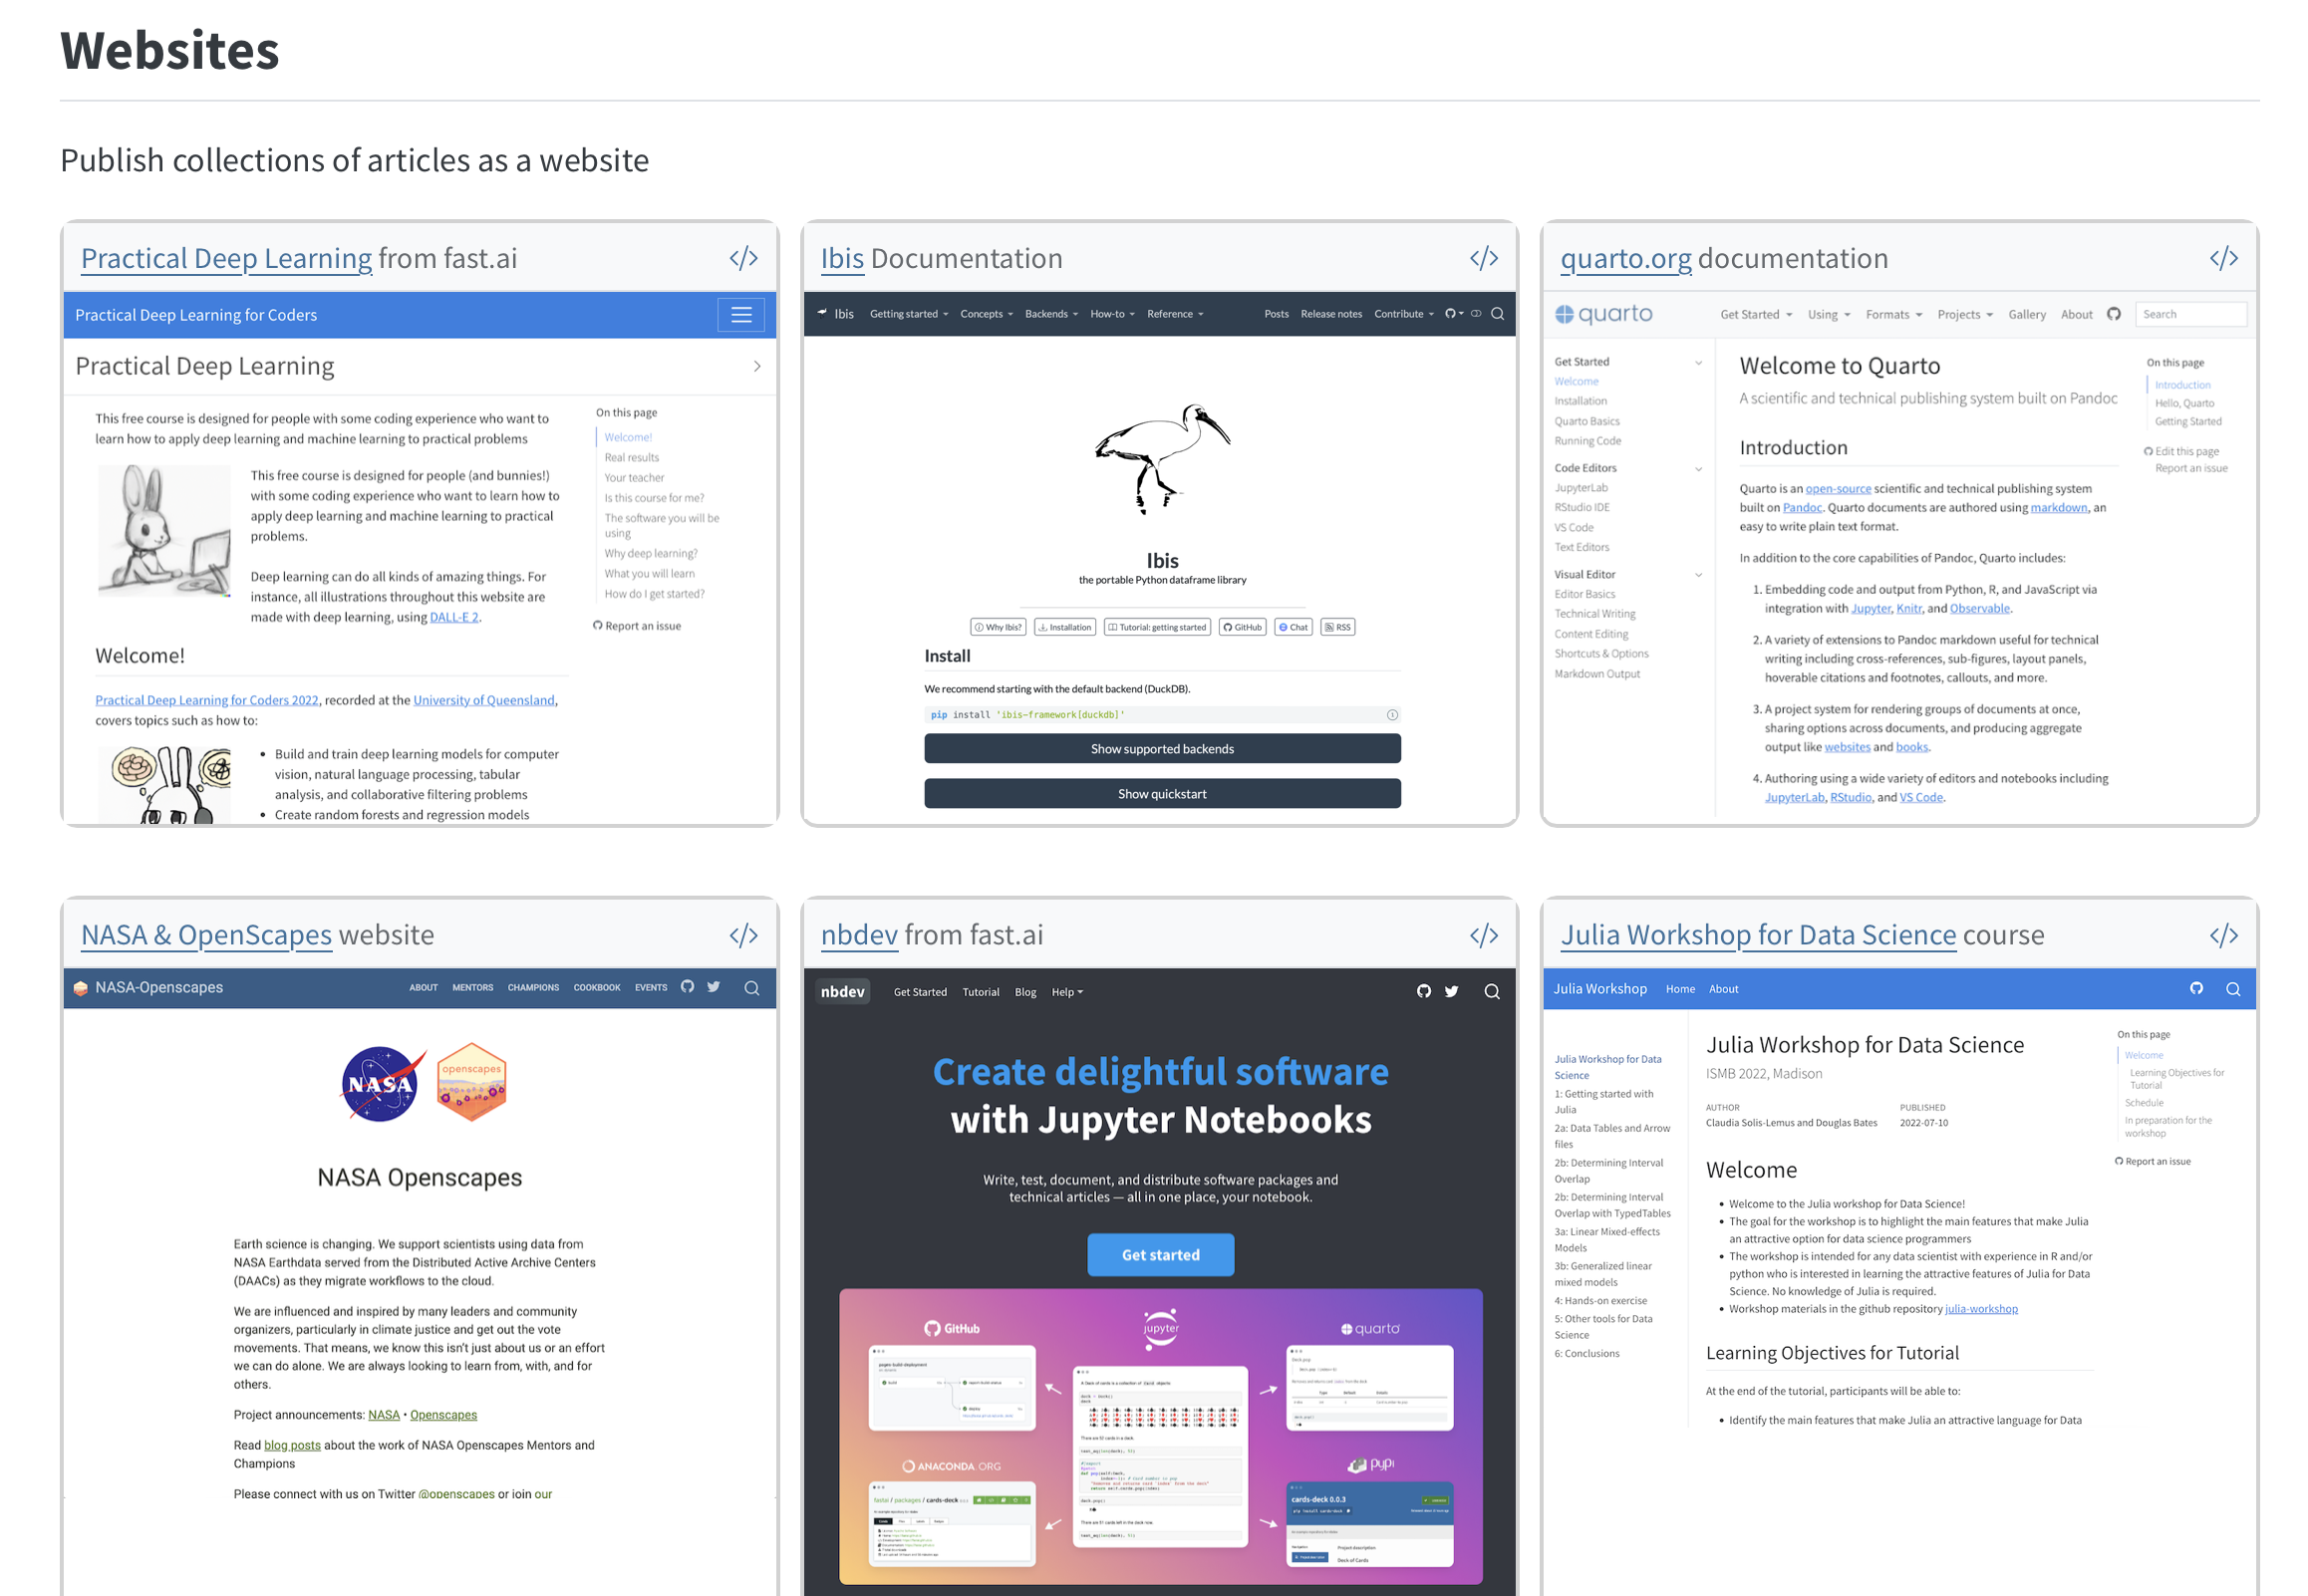
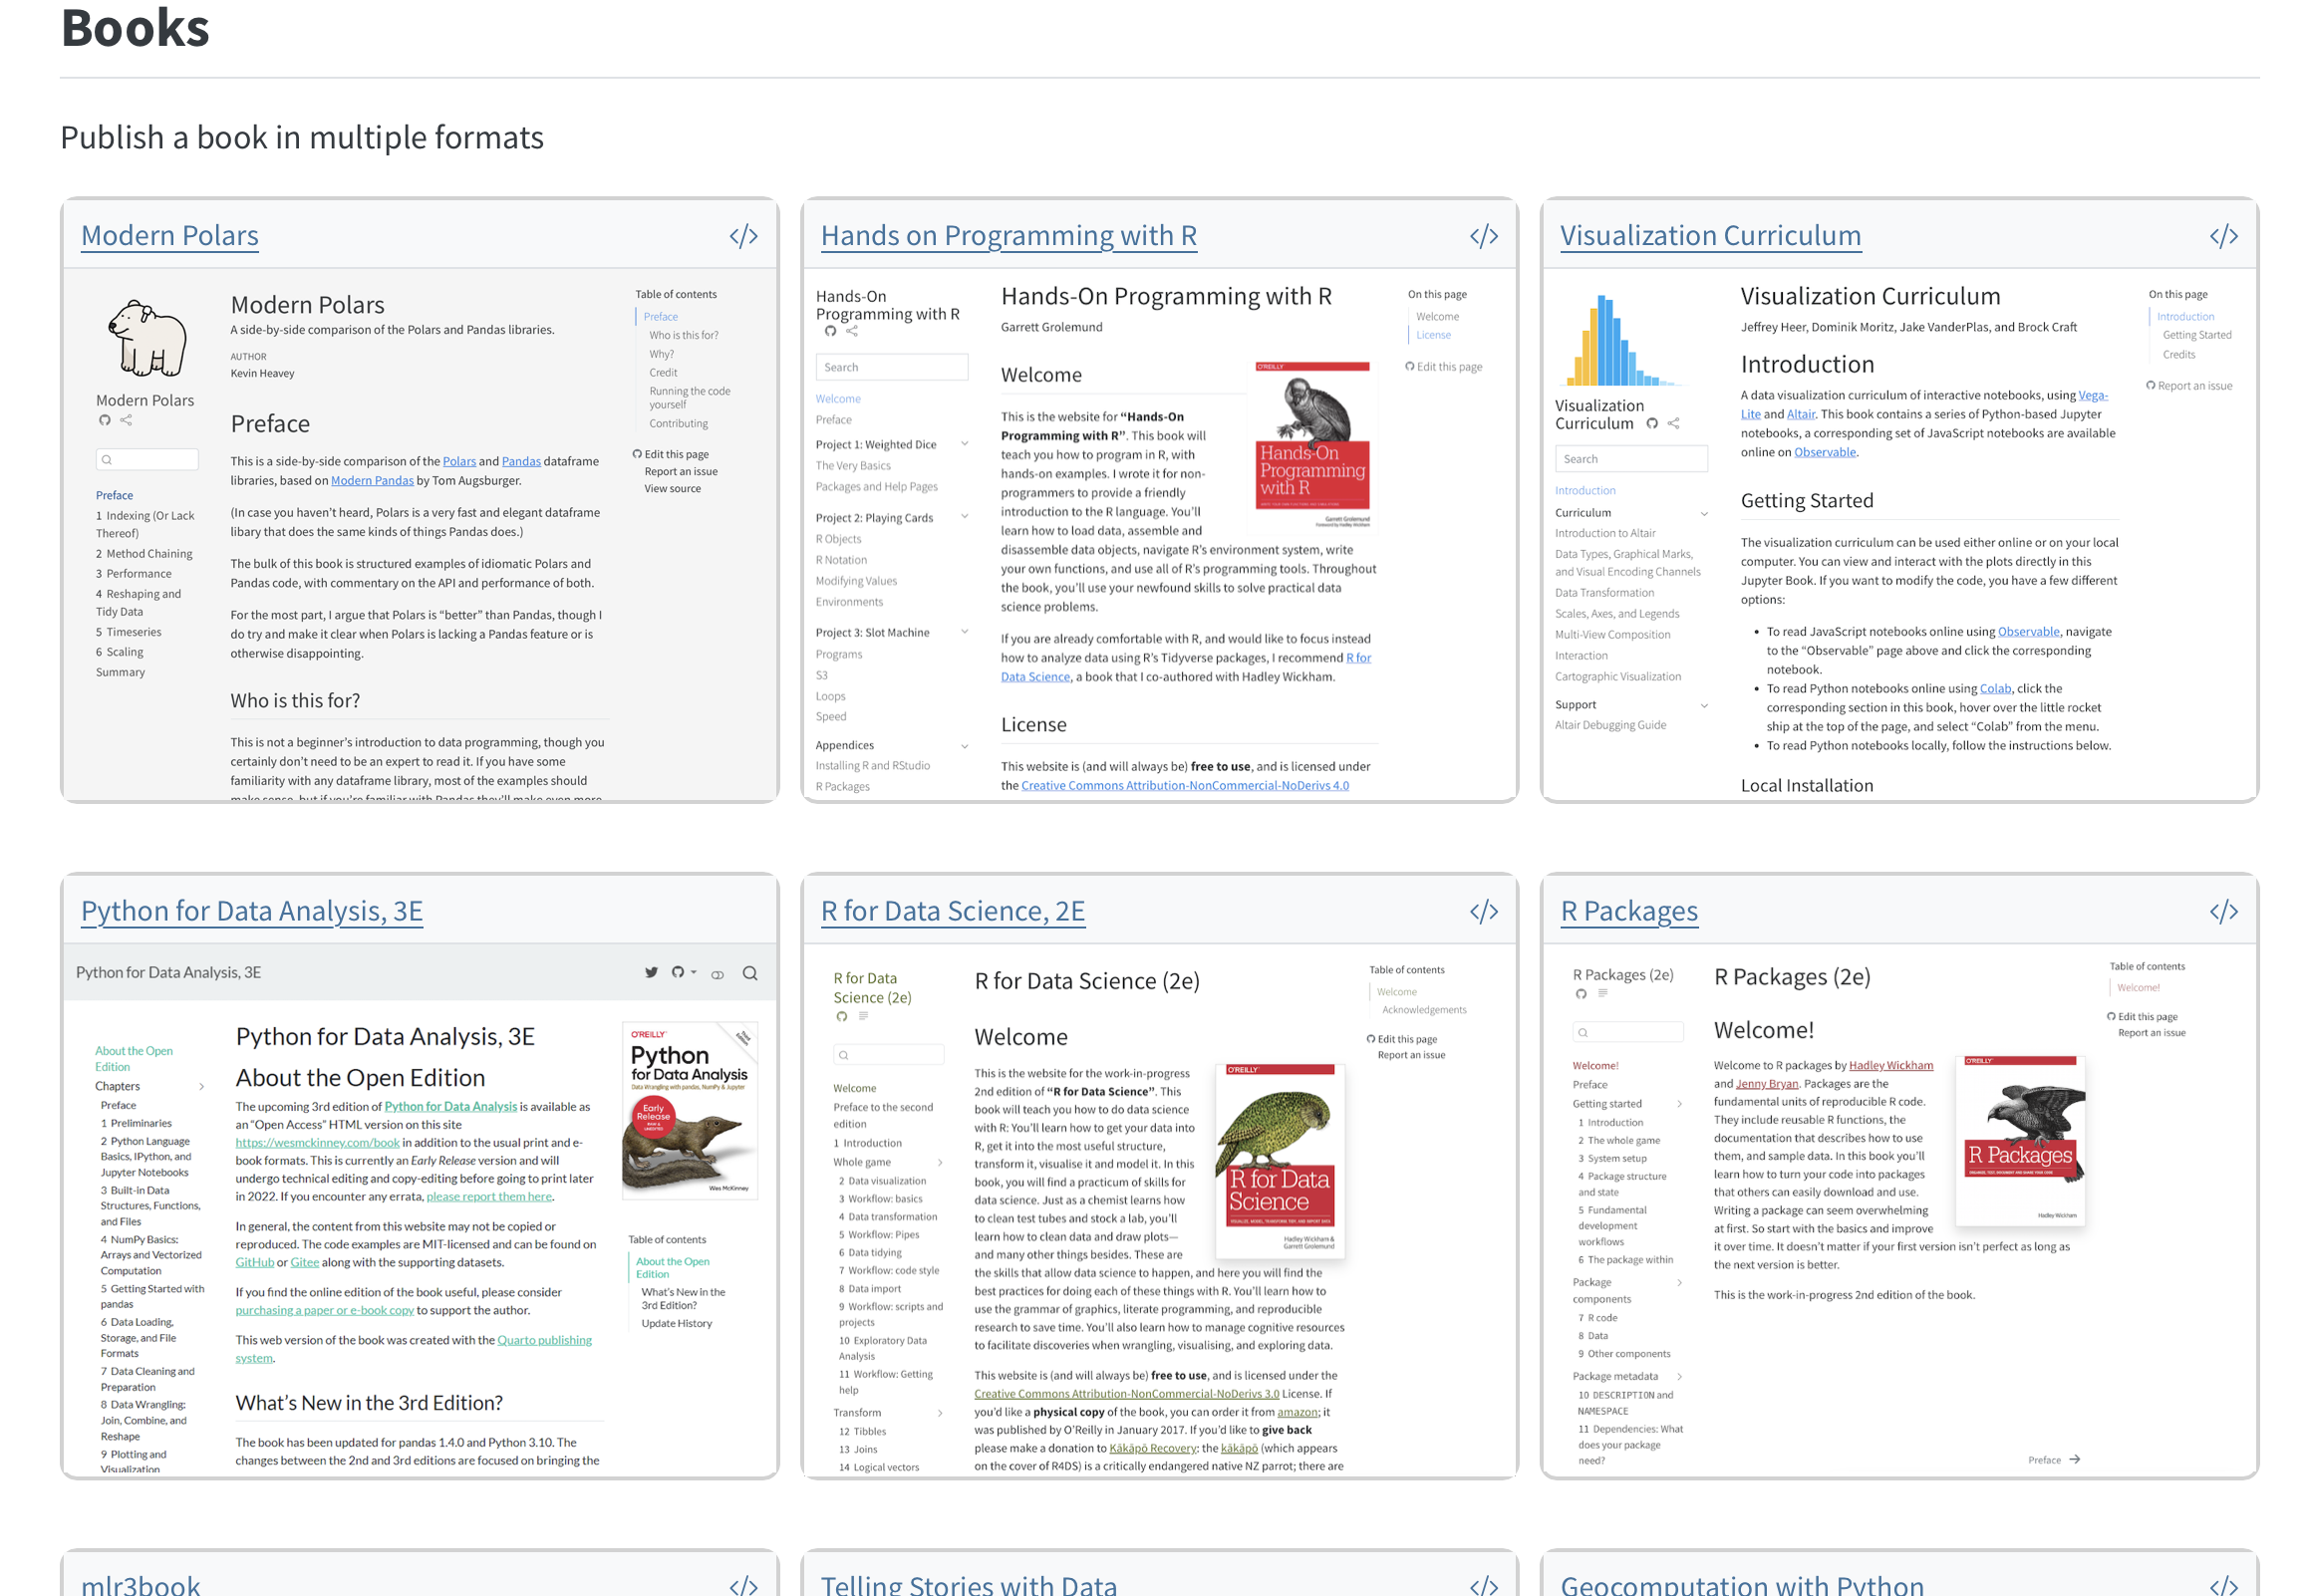
Toward more reproducible scholarly workflows
- Protocols
- Data cleaning, analysis, visualization pipelines
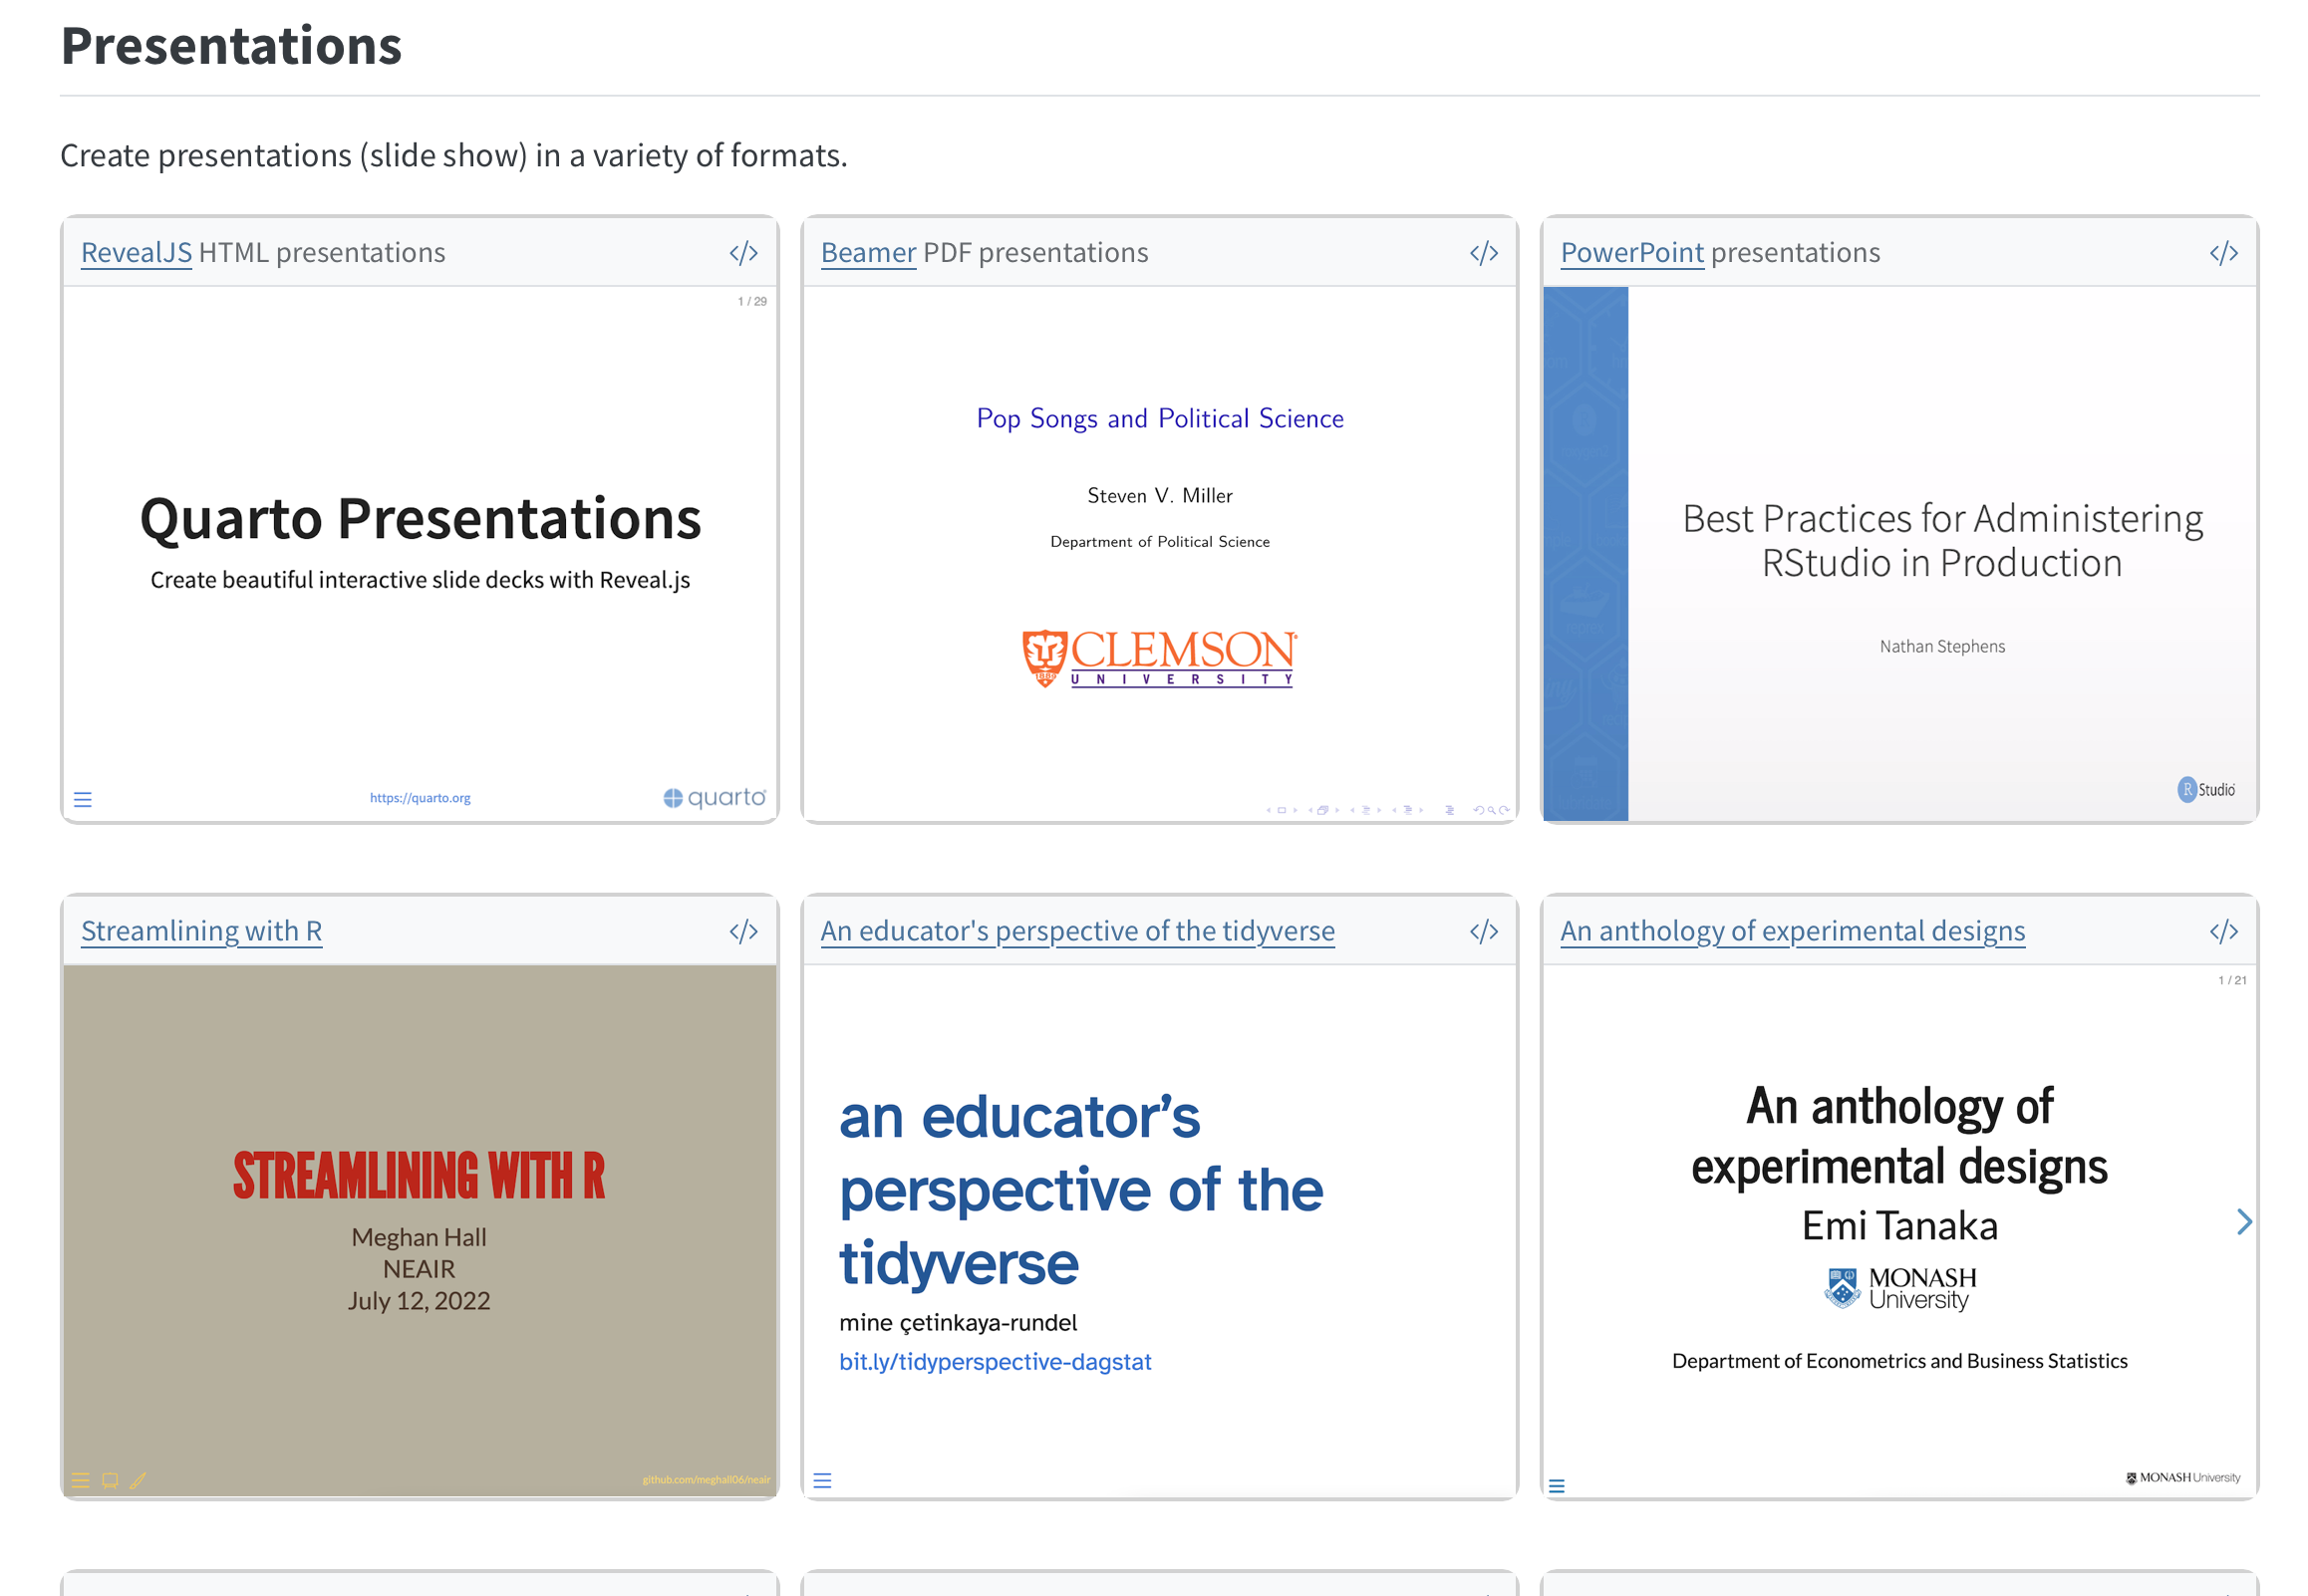
- Talks
- Professional websites/blogs

Footnotes
GitHub pages is free for public projects.
Add private files to
.gitignorePython & Jupyter notebooks workshop Today @ 3 pm: details
Alaina Pearce has implemented this.